Select a page
  • Account
    • Register / Forgot login?
  • Home
  • About InetSoft
  • Twitter
  • Facebook
  • LinkedIn
  • Google+
The Mashup The Mashup
Select a page
The Mashup The Mashup

College KPI Dashboard

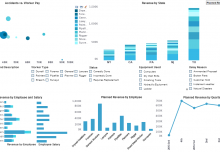
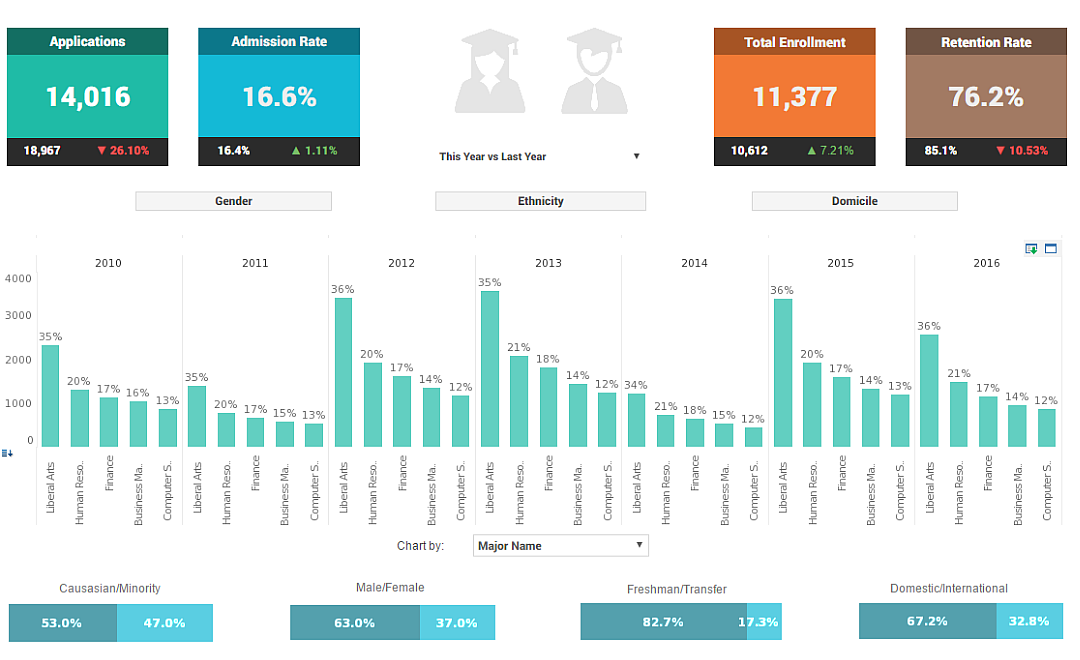
How can data visualization help admissions officers track student enrollment patterns? Check out this interactive College KPI Dashboard from InetSoft!


InetSoft HomeTop Vendor ReportTop 10 ReasonsRegister

Posted byBen Williams
May 17, 2019
Tags:bi software, data visualization, Style Intelligence
3
Share:

Related Articles

  • Should You Place Your Data in a Report or Dashboard – Three Ways to Decide
  • Try the Latest Style Scope Agile Edition – it’s Free!
  • Law Firm Dashboard Solution
  • Treasury Yield Curve Dashboard
Looking For a Software for Statutory Reporting?
How Machine Learning is Helping Personalize Travel Insurance Offers

©2023 InetSoft Technology Corp.