Big Data is a trending theme across the world of business, and even small organizations find accumulating raw data a straightforward task. Technology has made light work of gathering and storing massive amounts of information and much like any other surplus the challenge is turning this endless stream of data into something meaningful, engaging, and easy to understand.
Mold Your Data For Customers, Partners, or Both
Whether you’re an entrepreneur presenting to potential investors or an established business owner expanding into a new customer pool your aim is to quickly make the biggest impact possible on your audience as quickly as possible. Unsurprisingly, spreadsheets simply don’t do justice to large data sets, especially if you’re using multiple data sources, complex algorithms, or comparative data.
Each type of audience will benefit from a unique reporting style. The “bottom line” often means different things to different people, and winning everyone over requires some flexibility and a dynamic touch.
Charts, Graphs, & The Bottom Line
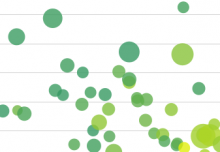
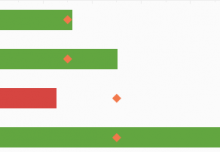
Spreadsheets eventually evolved to include charts and graphs, allowing users to plot data in colorful lines, pies, and bars like never before. Even basic charts allow you to easily summarize large tables, track changes over time, or describe how several metrics compare to one another.
Unfortunately, as informative as they are, charts often lack an important piece of the puzzle: they fail to engage the audience. These static images are designed to rapidly answer questions about data, not to catch the attention of on-lookers.
Using Infographics To Spark Interest
Infographics often combine charts and graphs with data tables, flashy colors, and are able to “tell a story” with the data. Infographics give context that is hard to achieve with a chart, and the imagery and design make them fun and engaging for the viewer. A well-made Infographic can introduce a concept and rapidly disperse several high-level points, all while looking great!
For most business owners, however, infographics come at a prohibitive cost as design fees can escalate quickly for something that will only be used for a limited time. They are also inherently limited to a small amount of data, and are meant to share big concepts, not in-depth research spanning a variety of topics.
Most data for businesses needs to be updated and monitored on an ongoing basis, and should be modified to reflect changes in the underlying services or products. For instance, an Infographic for the top selling music genres based on location may grab your attention, but will fail to help you make decisions in the long term. Charts on the other hand can be updated very easily, but may struggle to give the user the information pertinent to them without also becoming overwhelming.
The Future Of Modern Reporting
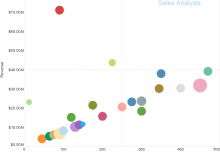
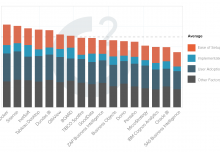
If spreadsheets aren’t cutting it anymore, and infographics just don’t have the power you need, an interactive dashboard may be the solution you seek. More engaging than a pie chart, and less work-intensive than Infographic, a dedicated business intelligence engine can help you summarize and describe data in new ways, helping you reach the bottom line for any target audience.
Break free from the restraints of single metric graphs, and share data with multiple variables such as time and location. Boil down multidimensional datasets instantly, focusing your summary on the information that’s important to you and make changes on the fly!
Interactive, Interesting, and Informative
When we talk about big data we usually call it “Business Intelligence,” so make sure you treat it as such. If you aren’t leveraging your data, you could be missing immense opportunities to gain customers, insights, and profitability. Big Data analysis was once a concept only understood by large corporations with deep pockets, but tools like Style Scope have given even the smallest players the chance to utilize this “secret weapon.” Data mashups no longer require hours of study by data scientists, and now happen on your iPad at the coffee shop.
Startups, from boutiques and crafts, to apps and digital services, now have the power to harness big data at its full potential. With Style Intelligence your BI platform can scale with you, meaning that if you’re the next big thing, your BI tools are ready to grow with you. Make better decisions with your data, and see where true business intelligence can take you!