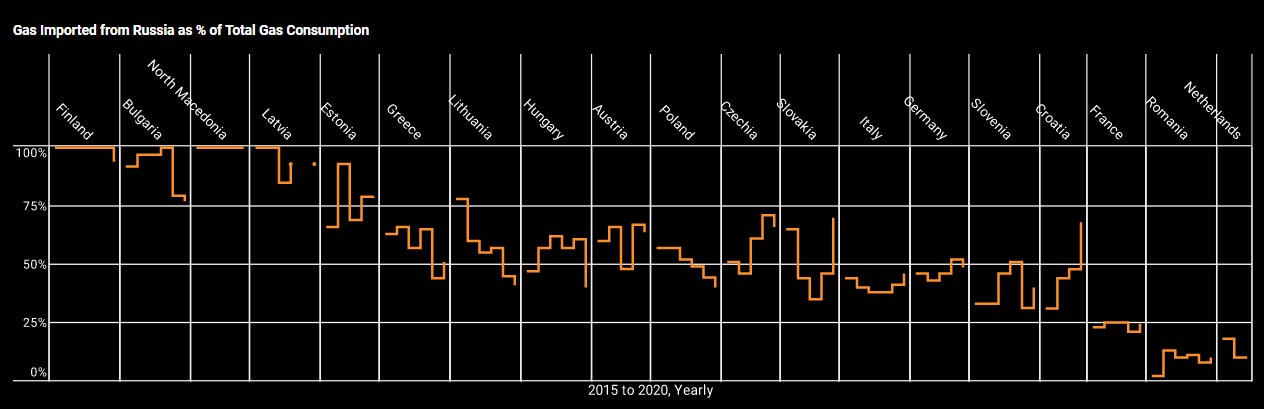
Wondering what will be the shortfall if Russian gas gets cut off? This InetSoft dashboard displays gas imported from Russia as a percentage of total consumption, broken down by country. Interact with the dashboard here.


April 1, 2022

Wondering what will be the shortfall if Russian gas gets cut off? This InetSoft dashboard displays gas imported from Russia as a percentage of total consumption, broken down by country. Interact with the dashboard here.