Agricultural Analytics Dashboard
Agriculture has gradually transitioned from traditional experiential models into the digital era, and our agricultural dashboard stands as your powerful tool for enhancing crop yield.
The InetSoft Agricultural Analysis Dashboard is designed to provide you with a comprehensive understanding of global agricultural production and crop yield in different nations.
Our dashboard integrates a range of data, including crop types, national statistics, weather conditions, pesticide usage, yield data, and more, to empower you to make informed agricultural decisions.


InetSoft's Agricultural Dashboard
This InetSoft dashboard incorporates various visualization tools, such as tables, bar charts, line graphs, maps, and more, to assist you in gaining a better understanding of the data and its underlying insights. With the use of filters, it also helps you swiftly pinpoint your areas of interest, for example, countries, crop types, and years. There is no need for prior data analysis experience, making it a straightforward and user-friendly operation.
By using InetSoft's Agricultural Analysis Dashboard, the following example questions could be easily addressed:
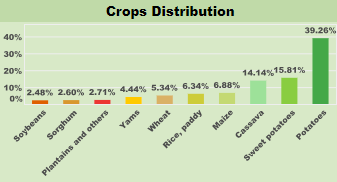
- What is the distribution of different types of crops in each country?
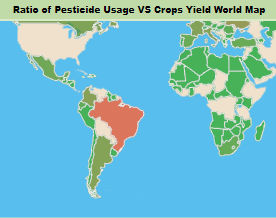
- What is the relationship between crop yield for different types of crops and factors like rainfall, temperature, and pesticide usage?
- To what extent do countries rely on pesticides?
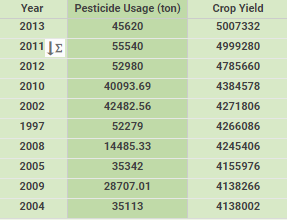
- What trends are observed in the annual global/national crop values?
- Which temperature, humidity, and pesticide usage levels are conducive to increasing crop yield for different types of crops?
If you are also seeking an agricultural analysis dashboard to help you monitor agricultural data and are looking to enhance productivity and sustainability through data-driven methods, the InetSoft Agricultural Dashboard will be your top choice.

What Analytics Does a Major Agricultural Enterprise Do?
These analytics span across different domains and can include:
- Yield and Crop Analytics:
- Analysis of historical yield data to identify trends, patterns, and factors affecting crop productivity.
- Predictive analytics to forecast crop yields based on factors such as weather conditions, soil quality, and agricultural practices.
- Crop monitoring using satellite imagery, drones, and IoT sensors to track crop health, growth, and development in real-time.
- Optimization of planting strategies, irrigation schedules, fertilization practices, and pest management techniques to maximize yields while minimizing input costs and environmental impact.
- Supply Chain and Logistics Analytics:
- Optimization of supply chain networks to ensure efficient transportation, storage, and distribution of agricultural products.
- Analysis of demand patterns, market trends, and customer preferences to forecast demand and optimize inventory levels.
- Route optimization and scheduling algorithms to minimize transportation costs, reduce delivery times, and improve customer service.
- Monitoring of logistics performance metrics such as on-time delivery, delivery accuracy, and transportation costs to identify areas for improvement and cost savings.
- Financial and Economic Analytics:
- Financial analysis of farm profitability, cash flow, and return on investment for different crops, fields, and farming practices.
- Risk management analysis to assess and mitigate risks related to market fluctuations, weather events, regulatory changes, and operational disruptions.
- Economic impact analysis to evaluate the contribution of agriculture to local economies, employment, and overall GDP.
- Cost-benefit analysis of investment decisions related to land acquisition, equipment purchases, technology adoption, and sustainable farming practices.
- Sustainability and Environmental Analytics:
- Environmental impact assessment to measure and reduce the carbon footprint, water usage, and chemical runoff associated with agricultural activities.
- Analysis of soil health, biodiversity, and ecosystem services to promote regenerative farming practices and conservation efforts.
- Compliance monitoring with environmental regulations and sustainability standards to ensure responsible stewardship of natural resources.
- Integration of sustainability metrics into decision-making processes to balance economic viability with environmental and social considerations.
About InetSoft
InetSoft provides organizations an easy and agile BI solution in the form of StyleBI, a robust and intuitive application that offers users with superior visualization capabilities and flexibility than other competitors.
StyleBI's features and abilities enable companies the opportunity to experience a business intelligence program that both business-end and experienced IT users alike can utilize to produce high-quality visualizations that rival other providers.
More Articles About Industrial Analytics
Energy and Utilities Storage Strategy - Storing sustainable energy is incredibly difficult, as energy production is typically periodical and often lacks clear-cut patterns or structure. As such, data software is required to measure energy storage and provide the insight required to understand capacities as well as specific requirements during particular weeks or months of the year...
Examples of Industry Dashboards - Are you curious as to how interactive web dashboards can help you explore your business data? Below are some examples of industry-specific interactive dashboards built with InetSoft's Style Scope. Click on any dashboard that interests you, and a live interactive version will open in a second tab of your web browser...
Good Industrial Reporting Software - Are you looking for good industrial reporting software? InetSoft's pioneering dashboard reporting application produces great-looking web-based dashboards with an easy-to-use drag-and-drop designer. View a demo and try interactive examples. All new customers get mentoring assistance for free to speed up their project delivery...
Industrial Hygienist KPI: Exposure Monitoring - An essential component of industrial hygiene is exposure monitoring, which entails calculating the concentrations of potentially harmful materials or agents in the working environment. When evaluating worker exposure to different chemicals, gases, particles, and other potentially hazardous contaminants...