Try InetSoft's Analytic BI Tools
Are you looking for the best analytic BI tools? InetSoft is a pioneer in making BI software that is easy to deploy and easy to use. Build self-service oriented dashboards and visual analyses quickly. InetSoft's data mashup engine solves the data access and transformation challenges that other tools cannot. View a demo and read customer reviews.


Why InetSoft?
InetSoft's analytic BI tool is easy enough to be:- Deployed in just weeks
- Learned by end users with minimal training
- Used by any executive without the aid of IT
- Adaptable to changing data and business needs
- Used for data exploration through visualization
- Capable of maximum self-service
- Attract the attention of executives
- Meet the demands of power users
- Scale up for organizations of any size
Evaluate Style Scope from InetSoft. It's Easy. Agile. & Robust.
Register for more info and free software software
What Kinds of Analyses Does an Epidemiologist Do?
Epidemiologists are public health professionals who study the distribution and determinants of health and disease in populations. They conduct a wide range of analyses to investigate patterns, trends, and risk factors associated with infectious and non-infectious diseases. Here are some common types of analyses that epidemiologists perform:
- Descriptive Epidemiology: Epidemiologists analyze demographic data, such as age, gender, race/ethnicity, and geographic location, to describe the distribution of diseases within populations. Descriptive epidemiology provides insights into disease occurrence, prevalence, and disparities across different demographic groups.
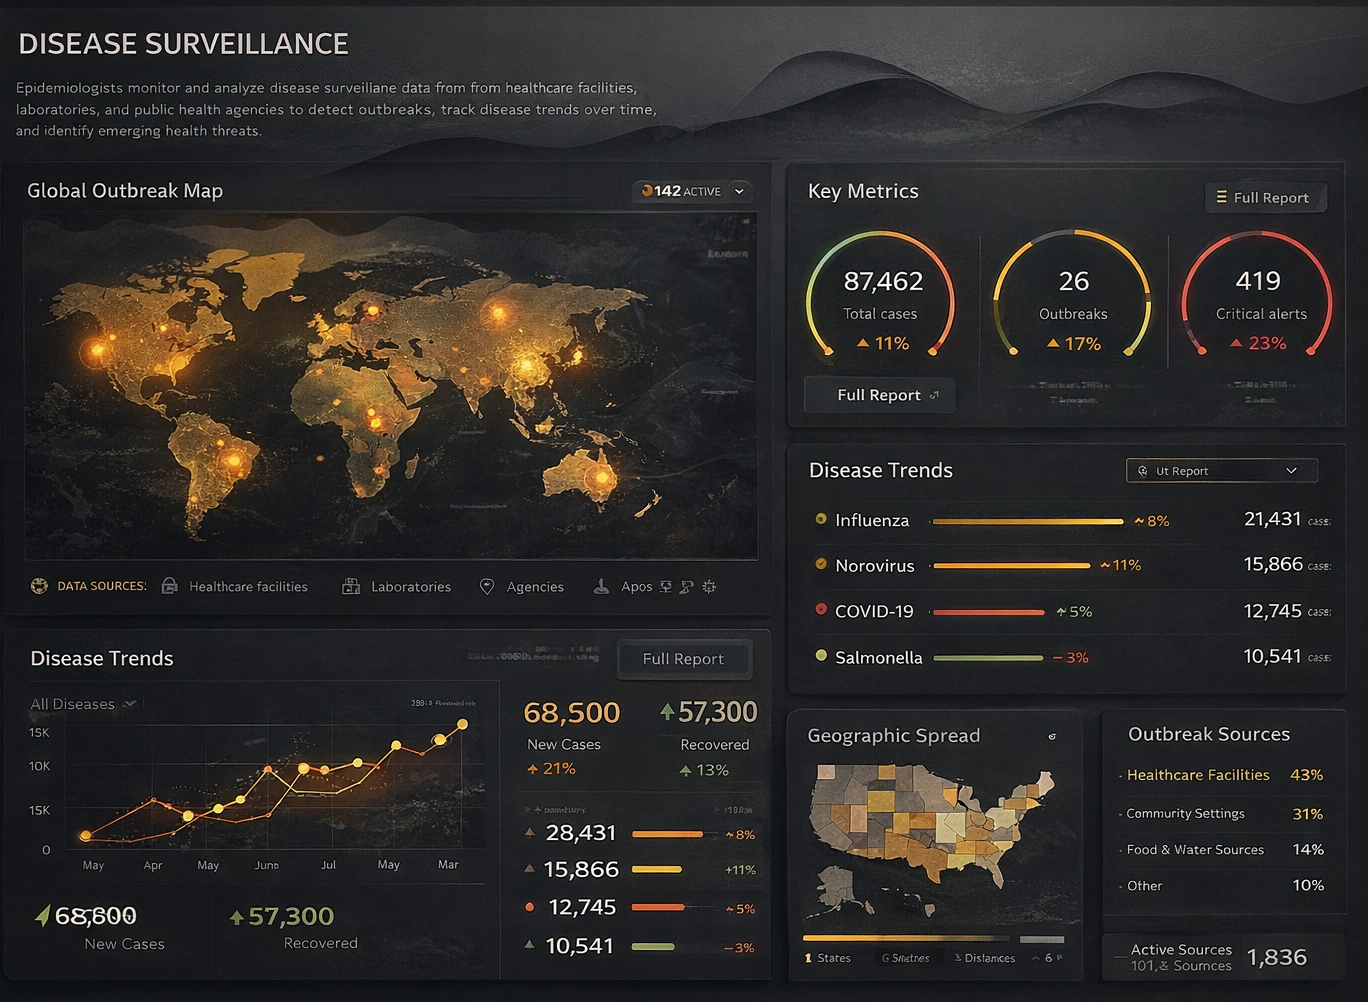
- Disease Surveillance: Epidemiologists monitor and analyze disease surveillance data from healthcare facilities, laboratories, and public health agencies to detect outbreaks, track disease trends over time, and identify emerging health threats. They use surveillance data to assess disease burden, geographic spread, and temporal patterns of diseases.
- Outbreak Investigations: During disease outbreaks, epidemiologists conduct investigations to determine the source of infection, identify affected individuals, and implement control measures to prevent further transmission. They use epidemiological methods, such as case-control studies, cohort studies, and contact tracing, to investigate outbreak clusters and assess risk factors for disease transmission.
- Analytical Epidemiology: Epidemiologists use analytical methods to study the relationship between exposures (e.g., environmental factors, behaviors, genetic predisposition) and health outcomes (e.g., disease incidence, mortality). Common analytical study designs include case-control studies, cohort studies, and cross-sectional studies, which allow epidemiologists to evaluate associations and infer causality.
- Risk Factor Identification: Epidemiologists identify and assess risk factors associated with disease occurrence and outcomes. They use statistical techniques, such as regression analysis and multivariable modeling, to quantify the strength of associations between exposures and health outcomes while controlling for confounding variables.
- Meta-Analysis: Epidemiologists conduct meta-analyses to synthesize findings from multiple studies and quantify the overall effect size of an exposure on a health outcome. Meta-analysis combines data from individual studies to increase statistical power, improve precision, and provide more robust estimates of associations.
- Survival Analysis: Epidemiologists use survival analysis techniques, such as Kaplan-Meier curves and Cox proportional hazards models, to analyze time-to-event data, such as disease onset, progression, and mortality. Survival analysis allows epidemiologists to assess factors influencing disease survival and estimate survival probabilities over time.
- Spatial Analysis: Epidemiologists use geographic information systems (GIS) and spatial analysis techniques to investigate the spatial distribution of diseases and identify spatial clusters or hotspots of disease activity. Spatial analysis helps epidemiologists understand spatial patterns of disease transmission, environmental risk factors, and disparities in disease burden.
- Molecular Epidemiology: Epidemiologists use molecular techniques, such as genotyping, sequencing, and phylogenetic analysis, to study the genetic diversity and transmission dynamics of pathogens. Molecular epidemiology provides insights into the source, spread, and evolution of infectious diseases and helps guide public health interventions.
- Health Impact Assessment: Epidemiologists assess the population-level impact of interventions, policies, and programs on health outcomes. They use epidemiological models and simulation techniques to estimate the potential benefits, harms, and cost-effectiveness of public health interventions and inform decision-making processes.

More Articles About BI Analytics
AI Content Proofreading and Editing - AI and machine learning are getting better with every piece of content they review, which is why you can count on automated proofreading and editing features these days. For instance, I use the following services...
AI in Early Disease Detection - Accurate and prompt diagnosis, a critical element in healthcare can fail due to human capacity and cognitive limitations, to the detriment of patients. Poorly collected or kept medical histories affect the accuracy of diagnosis by doctors relying entirely on such records. Laboratory mix-ups and large caseloads overwhelm medical staff at times and lead to fatal human errors that can maim or cost human life in the worst-case scenario...
Degree of User Interactivity - The first is the Degree of User Interactivity, the second is Data Volume, and the third is Calculation Complexity. And if you plot any analytic activity from analytics, whatever that is, to reporting, to even data mashups or search or optimization or simulation, you can plot them on these three axes. What you are seeing here is that analytics differentiates...
Mining KPI: Rock Fragmentation - The effectiveness of subsequent processes, such as crushing and grinding, is directly impacted by rock fragmentation, making it a critical component of mining operations. Increased productivity results from optimizing drilling and blasting procedures by measuring the size distribution of fractured rocks...