4 Reasons Why Real Estate Companies Use Dashboards
Real estate companies operate in an environment defined by constant movement—properties enter and leave the market, prices shift daily, leads fluctuate, and operational costs evolve with every project.
Dashboards give these organizations a way to consolidate all of this motion into a single, coherent view. Instead of relying on scattered spreadsheets or siloed departmental reports, leaders can see the entire business at a glance.
This unified visibility is especially important in real estate, where timing, negotiation leverage, and market awareness directly influence profitability.
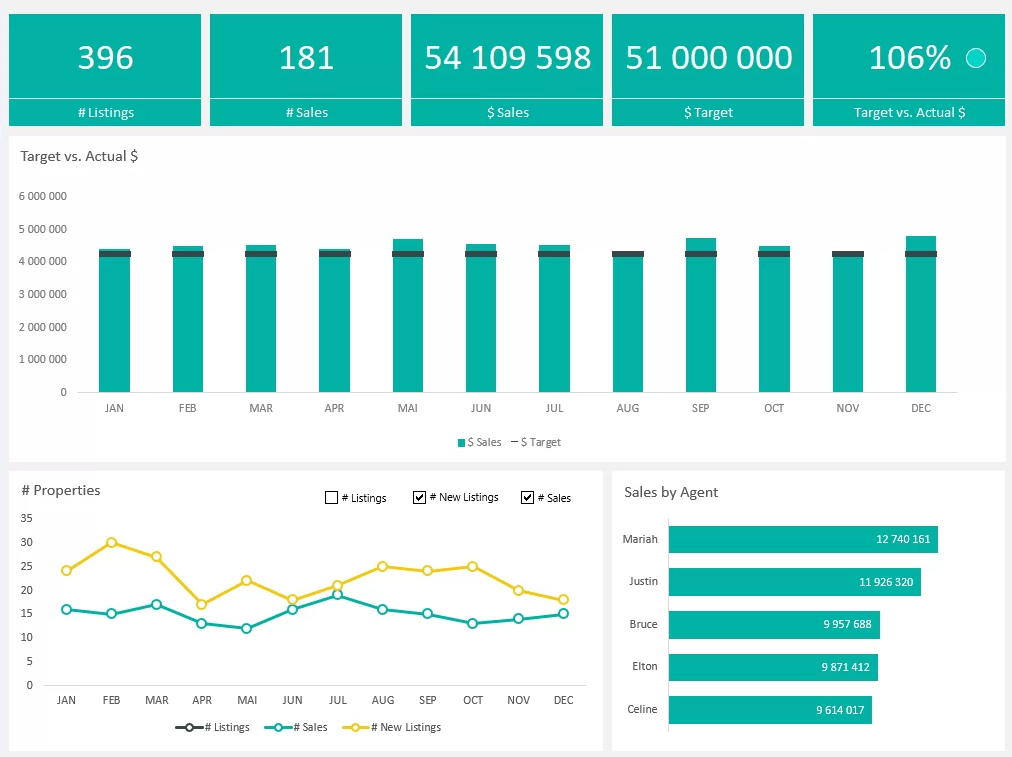

Dashboards also help real estate teams make decisions faster. Whether evaluating a new development opportunity, adjusting rental pricing, or forecasting occupancy rates, decision-makers need current and accurate data. A dashboard that updates automatically—pulling from CRM systems such as the best real estate CRM for their business, listing platforms, financial tools, and property management software—removes the delays associated with manual reporting. This speed is crucial when competing for listings, responding to market shifts, or optimizing investment strategies.
Another reason dashboards are so valuable is their ability to reduce uncertainty. Real estate involves risk: market downturns, unexpected vacancies, construction delays, and fluctuating interest rates can all impact performance. Dashboards allow companies to track risk indicators in real time, giving leaders early warning when trends begin to shift. For example, a sudden drop in lead volume or an increase in maintenance requests can be flagged immediately, allowing teams to intervene before the issue becomes costly.
Dashboards also strengthen communication across departments. Sales teams, property managers, finance groups, and marketing staff often work with different systems and priorities. A shared dashboard creates a common language for performance, ensuring everyone sees the same numbers and understands the same goals. This alignment reduces friction, improves collaboration, and helps teams coordinate more effectively around leasing targets, renovation schedules, or investment milestones.
Finally, dashboards support long-term strategic planning. Real estate companies must anticipate future demand, evaluate portfolio performance, and identify emerging opportunities. By visualizing historical trends alongside current metrics, dashboards help leaders spot patterns that would be difficult to see in raw data. This insight allows organizations to refine their acquisition strategies, adjust pricing models, and plan capital improvements with greater confidence.

Key Dashboard Types Used in Real Estate
Real estate companies use a wide range of dashboards depending on their business model, portfolio size, and operational needs. One of the most common is the property performance dashboard, which tracks occupancy rates, rental income, maintenance costs, and tenant satisfaction. This dashboard helps property managers understand how each building or unit is performing and where improvements may be needed.
Another widely used dashboard is the sales and leasing dashboard. This tool tracks leads, conversions, listing activity, agent performance, and average days on market. For residential brokerages, it provides visibility into which agents are closing deals, which listings need attention, and how marketing campaigns are influencing buyer interest. For commercial firms, it helps evaluate tenant mix, lease expirations, and negotiation timelines.
Investment dashboards are essential for firms focused on acquisitions and portfolio growth. These dashboards consolidate financial models, cap rates, cash flow projections, and market comparables. They allow investors to evaluate potential deals quickly and compare them against existing holdings. By visualizing risk, return, and long-term value, investment dashboards help firms make smarter acquisition decisions.
Construction and development dashboards are used by companies managing new builds or major renovations. These dashboards track budgets, timelines, contractor performance, and milestone completion. They help leaders identify delays, cost overruns, and resource shortages early, ensuring projects stay on schedule and within budget.
Finally, executive dashboards provide a high-level overview of the entire organization. These dashboards combine financial performance, operational metrics, market trends, and strategic KPIs into a single view. Executives use them to monitor the health of the business, evaluate long-term strategy, and make decisions that affect the entire portfolio.

How Dashboards Improve Operational Efficiency
Dashboards streamline operations by eliminating manual reporting tasks. Real estate teams often spend hours compiling data from multiple systems—CRM platforms, listing services, accounting tools, and maintenance systems. Dashboards automate this process, pulling data from all sources and presenting it in a clean, organized format. This automation frees employees to focus on higher-value activities such as client engagement, property improvements, or strategic planning.
Dashboards also improve accuracy. Manual reporting introduces errors, especially when data is copied between spreadsheets or interpreted differently by different departments. A centralized dashboard ensures that everyone sees the same numbers, updated from the same source. This consistency reduces confusion, prevents miscommunication, and improves decision-making.
Operational dashboards help teams identify inefficiencies. For example, a property management dashboard might reveal that certain buildings have higher maintenance costs or lower tenant satisfaction. A leasing dashboard might show that certain agents consistently outperform others or that specific listings are stagnating. By highlighting these patterns, dashboards help leaders allocate resources more effectively and address issues before they escalate.
Dashboards also support compliance and reporting requirements. Real estate companies often need to provide detailed reports to investors, regulatory bodies, or internal stakeholders. Dashboards make it easy to generate these reports quickly and accurately, reducing administrative burden and ensuring compliance with industry standards.
Finally, dashboards improve customer experience. When teams have access to real-time information, they can respond to tenant inquiries, buyer questions, and investor requests more quickly. This responsiveness builds trust, strengthens relationships, and enhances the company’s reputation.

How Real Estate Teams Build Effective Dashboards
Building an effective real estate dashboard begins with identifying the right KPIs. These metrics should align with the company’s goals—whether maximizing occupancy, improving profitability, expanding the portfolio, or enhancing tenant satisfaction. Choosing too many KPIs can overwhelm users, so it’s important to focus on the metrics that truly matter.
Next, companies must integrate their data sources. Real estate data often lives in multiple systems, so connecting CRM platforms, listing services, financial tools, and property management software is essential. A strong data services platform helps unify these sources, ensuring dashboards are accurate and up to date.
Design is also critical. Dashboards should be easy to read, with clear labels, intuitive layouts, and consistent color schemes. Visual hierarchy helps users understand which metrics are most important, while drill-down features allow deeper exploration when needed. Real estate dashboards should avoid clutter and focus on clarity, especially for executive users who need quick insights.
Real estate teams should also incorporate annotations and context. Numbers alone can be misleading without explanations. Adding notes about market conditions, renovation projects, or seasonal trends helps users interpret the data correctly and make informed decisions.
Finally, dashboards must be reviewed and updated regularly. As market conditions change, new data sources emerge, or business priorities shift, dashboards should evolve. Regular updates ensure that dashboards remain relevant, accurate, and aligned with the company’s strategic goals.

Why Dashboards Will Continue to Shape the Future of Real Estate
Dashboards are becoming increasingly important as real estate companies adopt more technology-driven workflows. With the rise of smart buildings, IoT sensors, AI-driven pricing tools, and digital tenant services, the amount of available data is growing rapidly. Dashboards help companies harness this data, turning raw information into actionable insight.
As competition intensifies, companies that use dashboards effectively will have a significant advantage. They will make faster decisions, respond more quickly to market changes, and operate more efficiently. Dashboards will also play a key role in sustainability initiatives, helping companies track energy usage, waste reduction, and environmental impact.
Ultimately, dashboards give real estate companies the ability to see clearly, act decisively, and plan confidently. They transform data from a burden into a strategic asset, enabling organizations to thrive in a complex and rapidly changing industry.

Key KPIs Real Estate Companies Track with Dashboards
Market Days
Knowing the number of days your property stays on the market provides a base for new strategies. Besides this, it helps in comparing different property categories. If you keep on reviewing these days, you get a clear idea about the pricing as well as the demand for properties. It helps you strategize for each property listing.
Occupancy Rate
One of the most useful KPIs for every real estate agent is an occupancy rate. This is highly important if you are working for rental properties. Real estate agents find out the real cause of a low occupancy rate with the help of dashboards.
For instance, if the occupancy rate is low, a real estate agent filters unrented properties in the dashboard. In this way, they can get to know the pattern or similarities among the unrented properties. It can be due to non-preference of a particular area, a high price, or a high advance payment.
Thus, data dashboards can help realtors figure out the cause behind the low occupancy rate.
Inventory
A critical analysis of an inventory reveals great things about a real estate business. For instance, real estate owners analyze how much more workforce is required if the inventory needs are growing.
Similarly, the evaluation of inventory informs decisions related to the additional requirement of marketing efforts, time, and technology. Furthermore, real estate owners are keener in knowing the current value of their property. If the value is growing in a particular area, they can plan to purchase more property.
Likewise, if the value is dropping, they can instantly plan to sell out their property. Just like these, there are many other KPIs like sales, revenue, commissions, etc., that help real estate firms.