How to Perform Data Mashup for Comprehensive Analytics in Higher Education
A data mashup can provide a thorough view of what's happening within higher education institutions and show what people should change to maintain the best student outcomes.
Since a data mashup combines information from multiple sources into one platform, it can help people uncover trends and identify actionable steps faster than they otherwise might. However, getting the best results from data-mashing efforts requires following a particular process.
| #1 Ranking: Read how InetSoft was rated #1 for user adoption in G2's user survey-based index | Read More |
Pinpoint the Desired Objectives
Administration leadership must start by determining what they want to achieve by creating the data mashup. One smart way to narrow down the possibilities is to consider how they're already used in higher education. A business intelligence dashboard is one of the most common types.
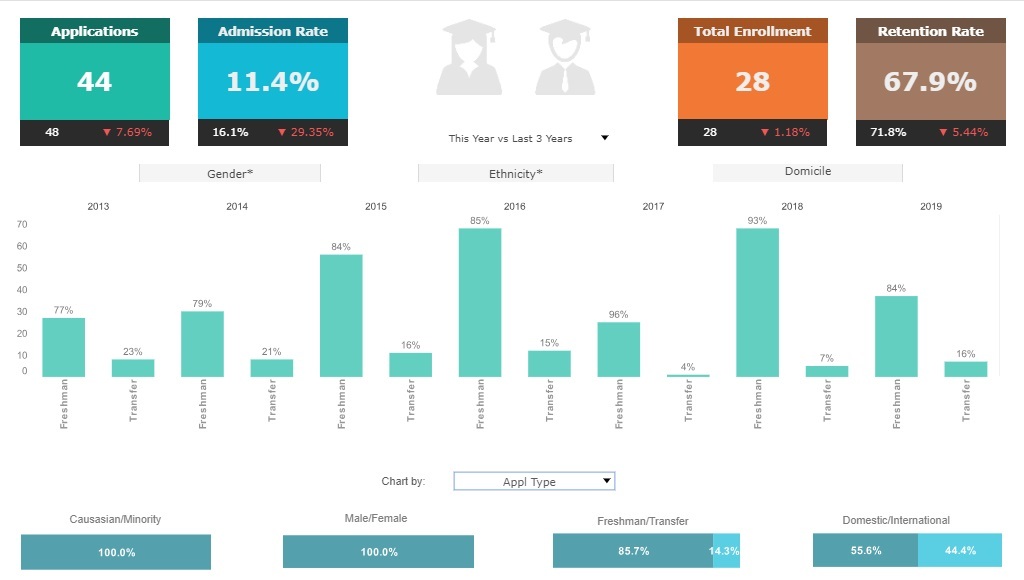
Higher education professionals use BI platforms to identify high-risk students who may only graduate with extra support. In contrast, the data could highlight characteristics shared by the happiest or best-performing learners.
Considering stakeholders' expectations can also help set meaningful goals for a data mashup. Would they care more about student retention, attracting new learners or something else? Narrowing down the top data mashup objectives helps people stay on track throughout the process.
Consider the Data Sources
People choose data mashup tools for better intelligence because they solve a common pain point experienced by organizations of all sizes and types. These products create business intelligence reports encompassing various information types.
Most higher education institutions have data from internal and external sources. It could range from professor evaluations completed by students at the end of a term to statistics about what percentage of kids in a particular major received job offers before or immediately after graduating.
People must decide which sources to use and why at this stage in the data mashup. Most modern institutions rely on learning management systems, which can be rich data sources. One of the easiest ways to get through this step is to determine which type of information most closely relates to the questions they want to answer. Reflecting on the previously chosen objectives makes that easier.
Relatedly, people should consider the size of the information sources they intend to use. The larger they are, the longer it may take to meet goals. Data mashup tools will undoubtedly make the analysis easier, but bigger projects often require more people working on them.
Examine and Prepare the Data
One of the challenges associated with the data collected by higher education institutions is that it's in various formats. Structured information follows a particular pattern. It could include invoices from the student bookstore or contact lists containing the phone numbers of all professors in a specific department. However, unstructured data, such as emails or social media mentions, does not follow a recognizable format.
Data mashup tools can handle both types, but knowing which you intend to use is still useful. That's because unstructured data may require more steps to get it into a valid format. Data preparation gets the information into the correct format for analysis. Some people preparing data in higher education settings combine large amounts of related information, making it more manageable.
Screening the information for duplicates is important during this step. Consider an example where a student's details exist in two different formats. This could skew the results, making them less reliable.
Combine and Study the Data
It's time to use data mashup tools to combine the information from various sources. The steps for importing data into a platform vary by provider, so take time to learn the process for the tool you're using. It typically involves clicking a button or selecting a menu option. Even if it's new to you, getting to know how it works should be relatively straightforward.
Once the information is in the data mashup tool, consider how to make it easier to interpret. Creating a data mashup for business intelligence allows people to answer specific questions and create well-defined action plans. Plus, information displayed in pie charts, bar graphs and other common visualization formats makes it easier to immediately start digesting the data and uncovering the main takeaways.
However, as you examine the data mashup, recognize and account for potential limitations. For example, using all your information is impossible, but omitting some may paint a limited picture of what's happening at a university.
Having numerous people study the data is also a best practice. Such an approach reduces the chance of misinterpretation because it involves various perspectives. Plus, having more people look at the results helps validate the outcomes. Additional views of the data-mashing content also increase the chances of spotting errors.
Individuals studying the results must also ensure the project meets the earlier objectives. If it doesn't, that's no reason for immediate concern. However, the team overseeing the data mashup may need to return to earlier steps to see where things got off track.
 |
Read the top 10 reasons for selecting InetSoft as your BI partner. |
Present the Data to Stakeholders
The final step of any data mashup process is to reveal the findings to the appropriate stakeholders. Many will understandably want to know how the information shown to them aligns with the broader goals of the higher education institution. For example, some universities have used data to create personalized learning paths for thousands of students, while others have developed interventions to increase graduation rates.
Since many people seeing the data mashup results may not be analytics experts, or even have IT backgrounds, you must envision yourself in the position of the stakeholders. Use your data presentation to answer the "What's in it for me?" question they'll have.
Emphasize how your findings contribute to the higher education institution's success. Reliable data can steer future actions, whether generating larger donations from former students or solidifying a university's reputation for being one of the best in a particular region.

