How to Measure the Performance of Your Explainer Video
In the ever-evolving digital marketing landscape, one strategy continues to rise above the noise and capture the hearts and minds of audiences: video marketing. With their unparalleled ability to convey messages, videos have been the cause of success for modern businesses.
Explainer videos are at the forefront of many types of videos as one of the most favorable contents for marketing. Concise delivery with compelling visuals is key. They are an invaluable tool that educates, entertains, and converts viewers into loyal customers. Here's an example of explainer video:
What Is Pinterest? | An Animated Video By Breadnbeyond
If you use explainer videos for marketing purposes, you should also perform data analysis. In the following discussion, we've curated some video marketing metrics to help you estimate your explainer videos. Keep reading to learn more.
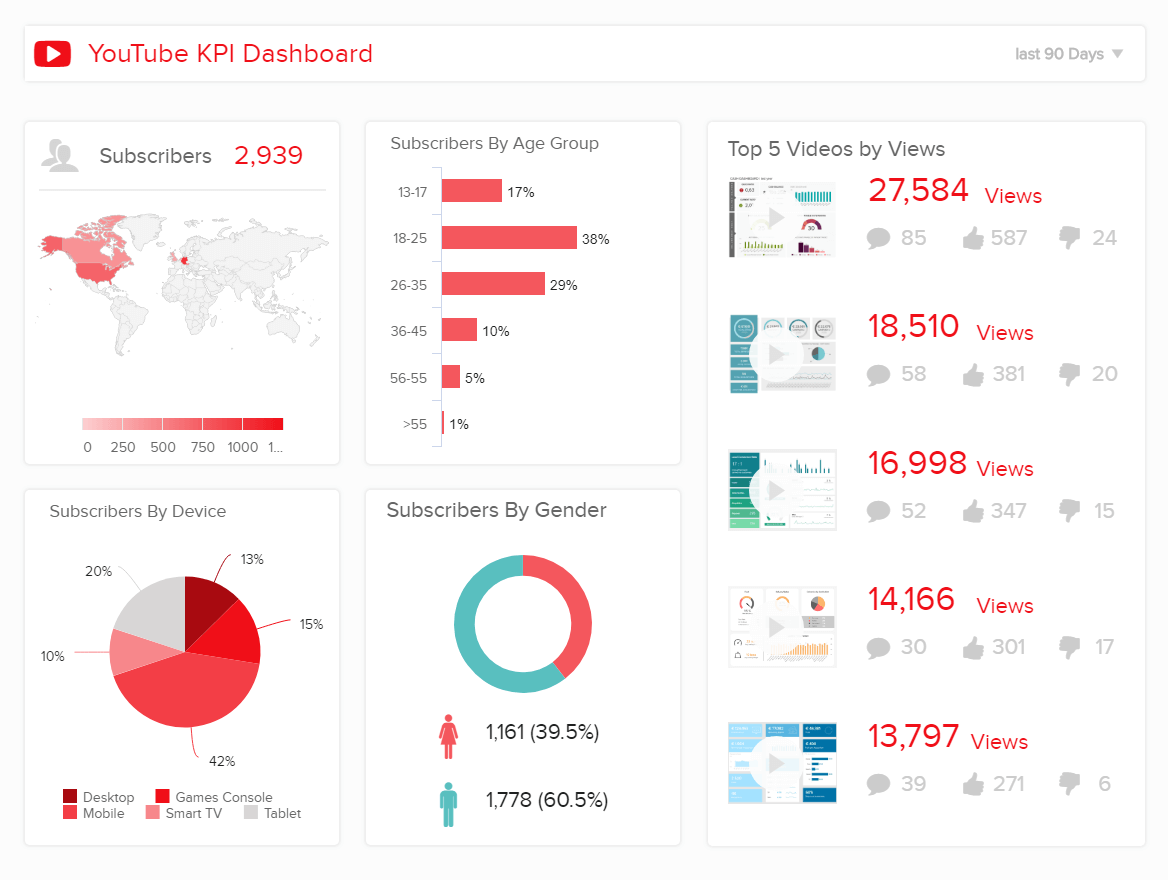

#1. View Count
View count is the number of times users have viewed your video. This metric measures the reach and popularity of your video content. Platforms like YouTube, Vimeo, and social media platforms provide view count data to track the performance of your videos.
To calculate the view count, you need to check the analytics or insights section of the platform where you host your explainers. Typically, the platform will display the total number of views your video has received. This count is updated in real-time as users watch your video.
It's important to note that platforms may have different criteria for what constitutes a view. For instance, YouTube counts a view after 30 seconds of watching, while other platforms may count a view after a shorter duration. Understanding the specific criteria used by the platform will help you interpret and analyze your view count accurately.
#2. Audience Engagement
Engagement rates are an important metric you should watch when using video marketing. They show how actively your audience interacts with your video content. Engagement rates include likes, comments, shares, subscriptions, and other forms of engagement. They offer valuable insights into how well your video resonates with viewers and can help you gauge the level of interest and impact your content generates.
Improving engagement metrics is crucial for enhancing the performance and effectiveness of your video content. Always encourage your audience to leave comments or share your content with other users. You can also edit your videos with Clideo before publishing to improve their overall quality. If the final footage still looks soft or compressed, you can upscale videos to 4K with AI to improve clarity and bring out finer details. Additionally, consider creating interactive explainer video content to enhance engagement.

#3. Play Rate
Play rate, also known as the play-through rate, shows the percentage of people who click the play button to start watching your video after landing on the video page. It is a metric that indicates how successfully your video thumbnail, title, and description entices viewers to play the video.
To measure the play rate of your video, you need to divide the number of video plays by the number of page visits or impressions. This formula will give you the play rate as a percentage. You can automatically track play rates through analytics tools provided by the platform hosting your video.
A higher play rate indicates that your video thumbnail, title, and description are engaging and compelling enough to encourage viewership. It shows that your video content aligns with the expectations set by the visual and textual elements.
#4. Conversion Rates
Conversion rates show the percentage of viewers who complete a desired action after watching your video. This action can vary depending on your goals, such as subscribing to a service, purchasing a product, joining a webinar, filling out a form, or subscribing to a newsletter.
It is a critical metric for assessing the effectiveness of your video in driving specific actions and achieving your marketing objectives. You can track it by dividing the number of viewers who completed the desired action by the total number of video viewers. Continue by multiplying the result by 100 to get the percentage.
You can also measure conversion rates with analytics tools or tracking systems that monitor user behavior and actions on your website or landing page. If your conversion result isn't satisfying, consider trying the following tips to improve it.
- Clearly define your Call-to-Action (CTA)
- Optimize landing pages
- Experiment with different versions of your video or landing page
- Enhance video engagement
- Streamline conversion process
- Analyze audience behavior
Check out more tips here: https://www.instagram.com/p/CoEr4OtLYc7/?hl=en

#5. Bounce Rate
Bounce rate estimates the percentage of viewers who leave your content without taking any further action after watching the video. It indicates the level of engagement and interest of viewers beyond the video itself.
A high bounce rate suggests that viewers don't find what they expected or desired after watching the video, leading them to leave without exploring other pages or performing additional actions. So, ensure that your video title and thumbnail represent the content.
Moreover, analyzing the bounce rate can provide valuable insights. A high bounce rate means your explainer video is ineffective for audiences. Consider optimizing your site's user experience, aligning video content with audience preference, and providing relevant next steps to avoid a high bounce rate.
#6. Return on Investment (ROI)
Estimating the Return on Investment (ROI) needs you to assess the financial return generated by your marketing efforts. There are some factors when calculating the ROI of your business, including tracking conversion rates and estimating the cost.Moreover, define the costs associated with creating and promoting your videos. Consider the cost of video production, editing, scriptwriting, hiring talent, and advertising costs. Include direct expenses (easily attributable to the videos) and indirect expenses (e.g., staff time).
ROI is typically in the form of a percentage. Meanwhile, the formula you can use for calculating ROI is: ROI = (Value of Conversions - Cost of Investment) / Cost of Investment
Regularly monitor the ROI of your video marketing campaigns to identify trends and make informed decisions. Improve your content, messaging, and strategies to resonate better with audiences. Use the data from analytics to make informed decisions and optimize your ROI over time.

Measuring Explainer Video Performance: Frequently Asked Questions
What metrics matter most when evaluating explainer video performance?
Key metrics include view‑through rate, average watch time, engagement rate, click‑through rate, conversion rate, and retention drop‑off points.
How can BI tools improve explainer video analytics?
BI platforms unify data from YouTube, Vimeo, website analytics, CRM, and marketing automation systems, enabling deeper insights into viewer behavior and business impact.
What is a view‑through rate and why is it important?
View‑through rate measures how many viewers watch the entire video. High rates indicate strong storytelling, clarity, and audience relevance.
Can explainer videos directly influence conversion rates?
Yes. When paired with BI dashboards, organizations can correlate video engagement with sign‑ups, demo requests, purchases, or other conversion events.
How do dashboards help identify weak points in a video?
Dashboards highlight drop‑off timestamps, low‑engagement segments, and viewer exit patterns, helping teams refine scripts, pacing, and visuals.
What data sources typically feed explainer video performance dashboards?
Common sources include YouTube Analytics, Vimeo Analytics, Google Analytics, marketing automation platforms, CRM systems, and customer feedback tools.
Who benefits most from explainer video performance dashboards?
Marketing teams, product managers, sales enablement leaders, and customer success teams gain actionable insights into how video content drives engagement and conversions.
AUTHOR BIO
Andre Oentoro is the founder of Breadnbeyond, an award-winning explainer video production company. He helps businesses increase conversion rates, close more sales, and get positive ROI from explainer videos (in that order).