Reasons Telecom Managers Use Dashboards
As the industry that pioneered the gathering and analysis of data, data intelligence is still very essential to the telecom industry. There's no doubt that the backbone of the ICT age is the telecom industry. With the vast and ever-increasing amounts of data passing through their networks every day, they must ensure the safety of this data and the efficiency of their critical assets through data intelligence.
Data visualization is crucial for managers of telecom companies. They have to deal with a lot of data at the same time, and the only way to handle that efficiently is to be able to visualize it. Telecom companies generate a lot more data than many other companies and industries. Managing this extensive data might result in problems for the managers and staff if they cannot handle it properly. Scheming, through hundreds of documents, will only create a backload of work and stress everyone. So, using a dashboard is a necessity for them. In economic terms, it is a need, not a want.
| #1 Ranking: Read how InetSoft was rated #1 for user adoption in G2's user survey-based index | Read More |
The customer satisfaction and network performance of telecom companies are very much dependent on data analytics. There are times when there is a need for a long term action while carrying out short term actions at the same time. For instance, the company might need to track churn rate over time and, at the same time, track daily team metrics. Managers might also need to view the call success rate of the network. All of these actions can only be done with a dashboard. Whether the need is currently to review KPIs such as the call setup time or network utilization, you need a dashboard for this.
For knowledge sake and the avoidance of doubts, here are some reasons why telecom managers need dashboards.
Improvement of the decision-making process
With the dashboard, telecom managers have a central location where they can access, analyze, and interact with real-time information, enabling them to work better and make data-driven decisions. The use of a dashboard allows the managers to monitor and measure performance in real-time, allowing them to be more efficient in carrying out their jobs. With the ability to analyze and visualize the data on the spot, they can focus on the KPIs (Key Performance Indicators) from different parts of the company right there on the dashboard. This provides them with valuable insight in real-time and accurate and timely decisions.
The performance of the different departments in the company is bound to improve as critical data are better analyzed. The data analysis is more intuitive because of the interactive visualizations, and this makes it easier to find out and deal with performance-related issues. This visualization interactivity allows the managers to delve deeper to find answers and solutions to problems with the service they provide.
Ability to access business intelligence faster to increase efficiency
Rather than scouring hundreds to thousands of files and documents, the dashboard provides high-speed and easy access to all the information that the manager may need at all times. The panel's interactivity is also an essential factor as it ensures that the managers can carry out the right actions at the right time. There is also the possibility of modifying an existing dashboard or creating a new one or customizing a panel to ensure that telecom managers get business intelligence in record time without any essay help from the IT team and another relevant department.
Dashboards make it easier to explore data and get new insights through visual data analytics and data discovery beyond the first panels.
 |
View a 2-minute demonstration of InetSoft's easy, agile, and robust BI software. |
More focus and alignment
As the managers can get a complete view of the data from their organization, it allows them to focus on key performance indicators that are more important to the organizations and align their processes with the business goals. The use of dashboards can drive certain behaviors in its users, which will invariably improve their work habits. It makes it easy to connect and access the company data with similar capabilities and experience irrespective of the data source (e.g., OLAP, Big Data, operational database, etc.). This helps to reduce the learning curve for analyzing new data.
Business growth through flexibility
It would be best if you continued to iterate upon a useful dashboard with every change in the company or when it grows. As the company continues to grow, the manager has everything he needs to sustain the growing together in one place: data preparation and presentation, data connectivity, administration, and self-service analytics. Getting a dashboard software that is made with ease of integration, extensibility, and customization is essential.
Enhancement of communication and collaboration
The success of any business organization is dependent on the level of communication from the executives and managers to the employees and the degree of collaboration between the employees as well. Excellent communication is an integral part of management. Managers will do all that they can to improve the level of contact with the people under them and a collaboration between the workers. This alone involves the use of a dashboard.
One sure way to succeed in any business organization is for colleagues to collaborate and share critical insights and KPIs. This will help them to make smarter and more informed business decisions. It will also ensure that everyone is on the same page and are working to achieve the company's objectives. Dashboards offer real-time tools to boost collaboration and also helps to highlight critical business insights that can be shared with others.
With the dashboard's aid, the manager can quickly bring members of their team on board with the intuitiveness, interactivity, and built-in tools of the panel, such as slideshows, notifications, notes, and scheduled report. It becomes easier to share essential business metrics with them.
Uses of dashboards for telecom companies
To understand why telecom managers use dashboards as listed above, one might first need to understand the uses of dashboards for telecom companies. There are three main uses of the dashboard for telecom companies, customer service overview, revenue and usage statistics, and network performance monitoring.
Customer service overview
The dashboard shows an overview of the company's KPIs, like support ticket statuses, subscription details, and customer satisfaction ratings. So, it gives the company an idea of how the users feel about their service. The rate of customer satisfaction is one of the KPIs displayed on the dashboard. This informs the manager or viewer of details such as resolved support ticker and the number of outstanding ones.

This can be used to track ticket resolution, while also making sure that the customer service teams prioritize the right issues with the customers. For instance, the customer service teams know that they have to make a customer with three to four unresolved tickets a priority over other customers that are better satisfied.
Revenue and usage statistics
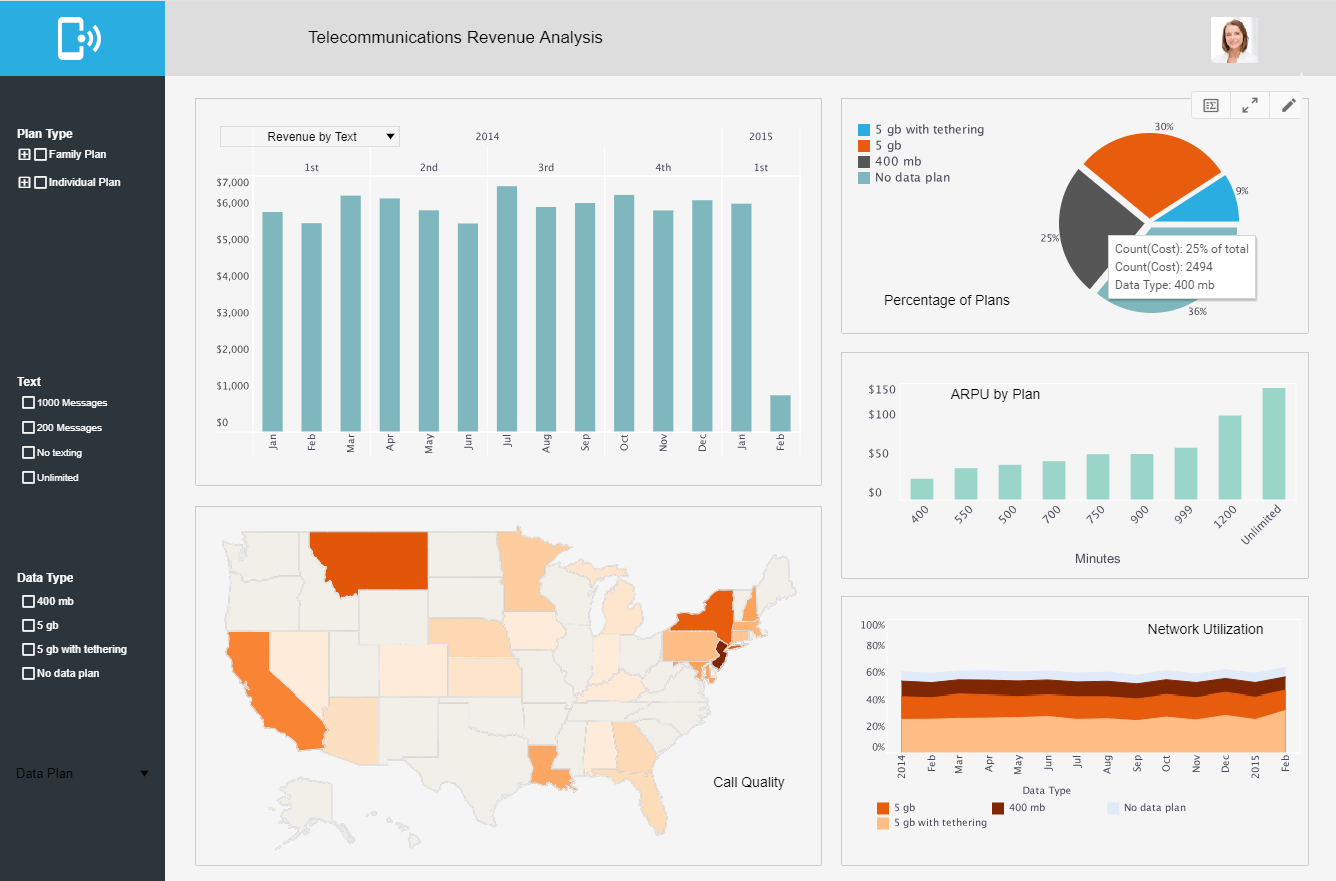
This is another crucial detail that can be viewed on the dashboard. Important KPIs such as network utilization, number of subscribers, and financial health are laid bare on the dashboard. This allows the company and manager to answer questions relating to their number of subscribers, revenue generated, and expenses incurred, their most-used services, etc.
All of this information is important as it provides greater insight into the company's financial state,
total users, and essential details like where they are most taxed. This data allows the company to efficiently
use its resources to meet up with the demands of the customers.
Some of the information provides detail on the company's network and service utilization, phone plan details –
which includes segmentation of subscribers based on service type and others such as total revenue, churn rate,
total expenses, etc.
Network performance monitoring
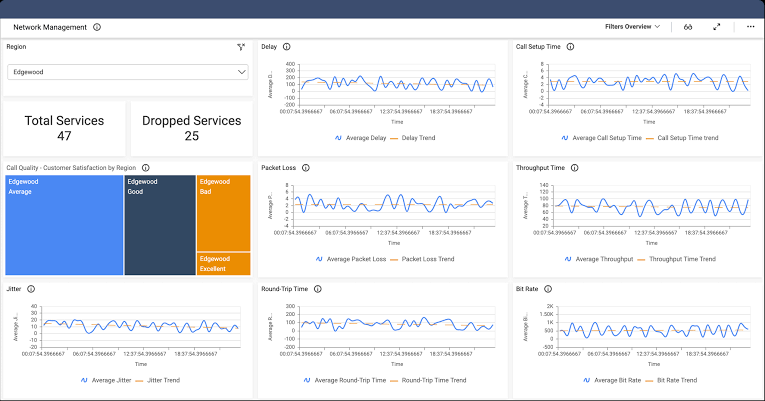
This is another essential detail for telecom companies, and the dashboard will include information on their network performance with the necessary KPIs. This will help the telecom company answer some questions about their networks, such as the number of customers' calls that the network dropped, whether customers are satisfied with their call service and quality, and other key metrics such as bit rate, delay, setup time, etc. The dashboard provides information for the company, which can be filtered based on different regions. This allows the viewer to see how well the company is doing in particular areas and compare it with other regions. It also ensures that they track their call quality and make the necessary improvements to increase customer satisfaction.
Conclusion
There is absolutely no reason for any telecom company not to make use of a dashboard. It is impossible and unthinkable. It is a significant part of the company and is how they track their service and improve it. All of the reasons why telecom managers use the dashboard that's mentioned above revolves around just one thing – improving the quality of service they provide.
 |
Read the top 10 reasons for selecting InetSoft as your BI partner. |


