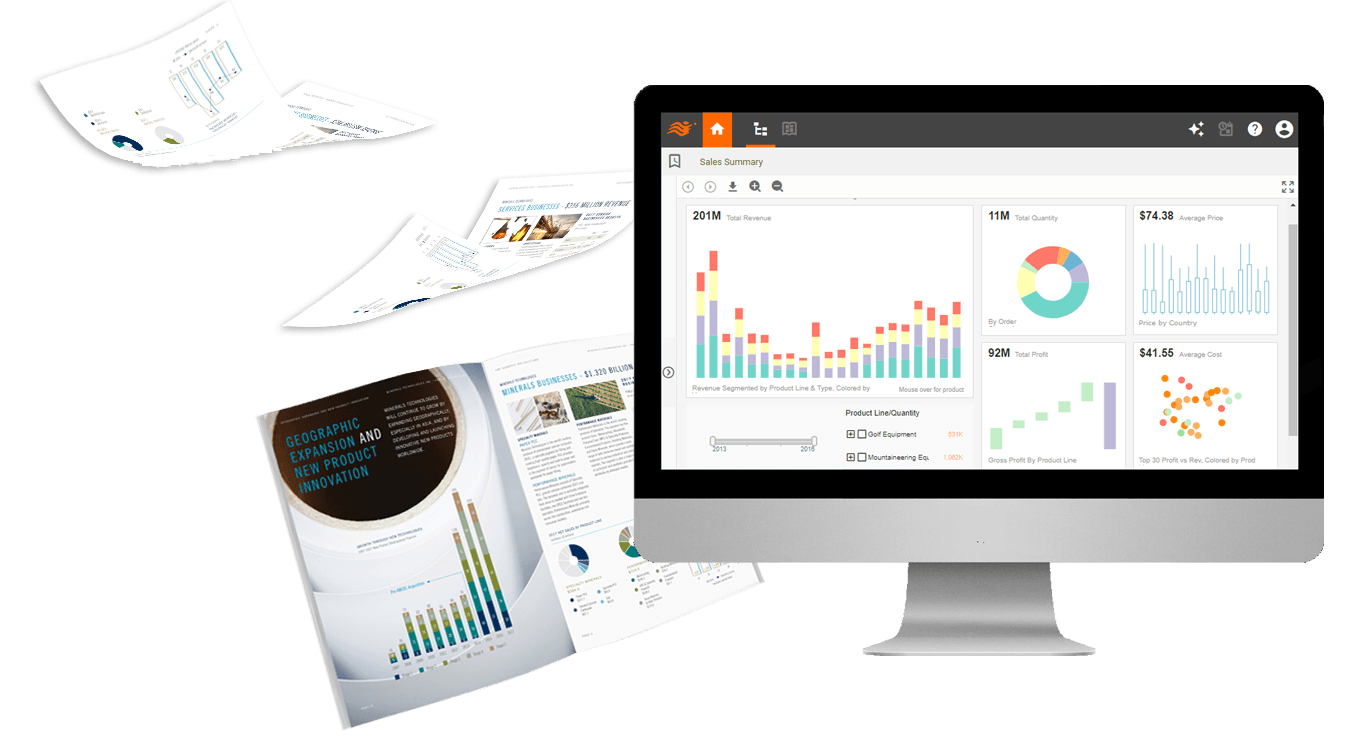
Visual Analytic Reports &
Online/Offline Document Reports
Easy Start and Rapid Deployment
with Free Dedicated Assistance
Award winning, trusted by 5,000+ customers since 1996
Free start:
Open source StyleBI is free to use
Free account for StyleBI Online Application
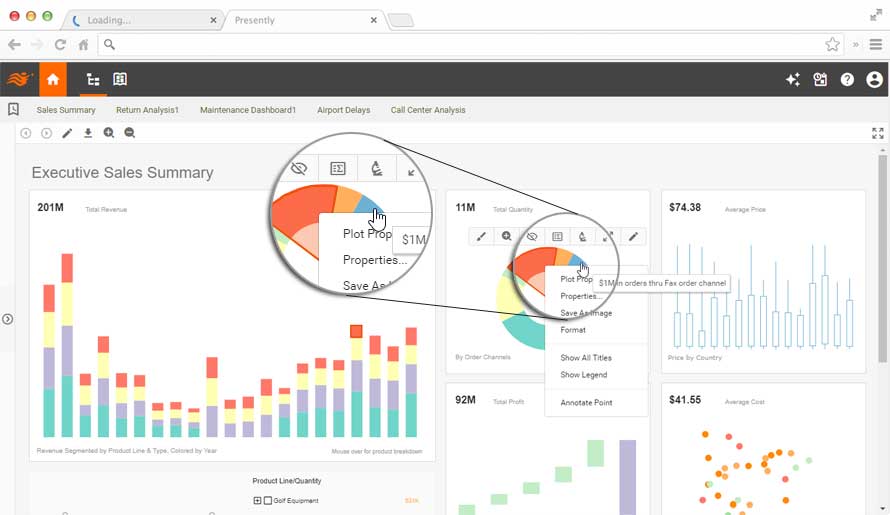
Business Users: Interactive Reports with Rich Customization and Ad Hoc Reporting
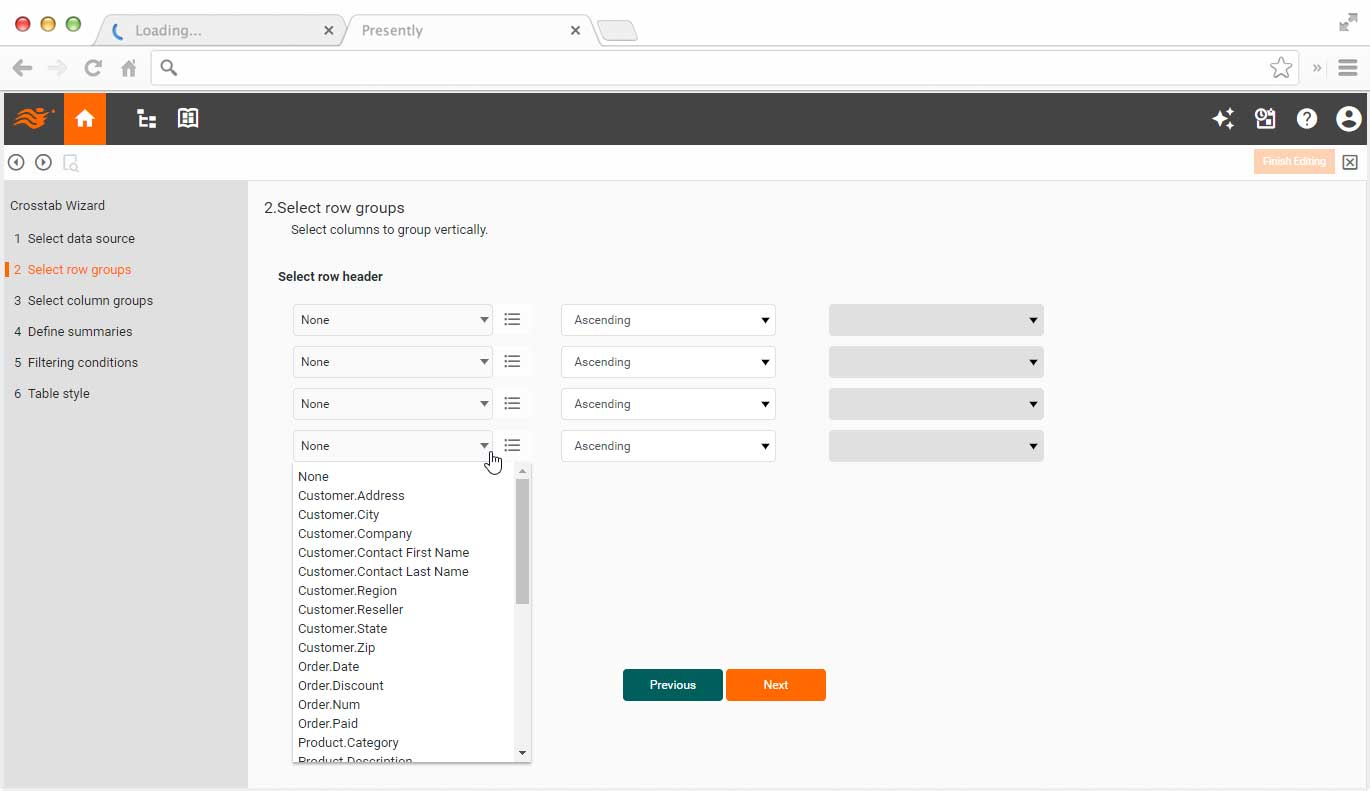
Designers: Rapidly Prepare Data and Design Visual Reports
What KPIs and Metrics Does a Labor Union Track in Reports?
Labor unions typically track a variety of key performance indicators (KPIs) and metrics to gauge their effectiveness in representing and advocating for their members' interests. These metrics can vary depending on the specific goals and objectives of the union, as well as the industries and sectors they operate in. Here are some common KPIs and metrics that labor unions may track in their reports:
-
Membership Numbers: One of the most fundamental metrics for a labor union is the number of members it represents. This includes tracking both total membership numbers and any changes in membership over time. Membership growth or decline can indicate the union's ability to attract and retain members, as well as its overall influence within the workforce.
-
Union Density: Union density refers to the percentage of workers within a particular industry or sector who are union members. Tracking union density helps unions assess their level of penetration and influence within the workforce. Changes in union density can reflect broader trends in labor relations and may influence bargaining power.
-
Collective Bargaining Outcomes: Labor unions negotiate collective bargaining agreements (CBAs) on behalf of their members to secure wages, benefits, and working conditions. Metrics related to collective bargaining outcomes include the number of successful contract negotiations, the terms of negotiated agreements (e.g., wage increases, healthcare benefits, retirement plans), and the duration of contracts.
-
Grievance Resolution: Labor unions often handle grievances on behalf of their members related to workplace issues such as disciplinary actions, contract violations, and workplace safety concerns. Tracking metrics related to grievance resolution, such as the number of grievances filed, time to resolution, and outcomes of grievances, helps unions assess their effectiveness in protecting members' rights.
-
Strike Activity: Strikes and other forms of industrial action can be powerful tools for labor unions to leverage in negotiations with employers. Metrics related to strike activity include the number of strikes called, the duration of strikes, and the outcomes of strikes (e.g., concessions obtained from employers).
-
Political Advocacy and Legislation: Many labor unions engage in political advocacy and lobbying efforts to influence legislation and public policy on issues relevant to their members, such as minimum wage laws, worker safety regulations, and labor rights. Metrics related to political advocacy may include the passage of legislation supported by the union, the outcomes of elections where the union endorsed candidates, and the level of engagement among union members in political activities.
-
Member Engagement and Participation: High levels of member engagement and participation are essential for the success of a labor union. Metrics related to member engagement may include attendance at union meetings and events, participation in union activities and committees, and rates of membership dues payment.
-
Training and Education: Labor unions often provide training and education programs to help members develop skills, advance their careers, and understand their rights in the workplace. Metrics related to training and education programs may include the number of members participating in programs, completion rates, and feedback from participants.
-
Financial Performance: Like any organization, labor unions need to track their financial performance to ensure fiscal sustainability. Metrics related to financial performance may include revenue from membership dues and other sources, expenses for operating costs and programs, reserves and assets, and overall financial health.
-
Member Satisfaction and Feedback: Lastly, labor unions may track member satisfaction and feedback to assess their effectiveness in representing members' interests and meeting their needs. This can involve surveys, focus groups, and other feedback mechanisms to gather input from members on their experiences with the union.

More Articles About Reporting
Ad Hoc OLAP & Layout Tools - StyleBI ad hoc reporting tools enables users to analyze multidimensional data from multiple perspectives. Construct your ad hoc analysis using quick and easy access to data from an original report. Users can immediately access data by using a point-and-click interface. This cuts down asking different divisions and/or departments for separate data in a pressing situation...
Data Management Implementation at a Hospital - Let's consider two different hospitals for a moment. One is a simple single site hospital with maybe 2,000 employees, and then at the other end of the spectrum you have a hospital with 10 different individual hospitals. So it's really a hospital system. It is very difficult to implement a new enterprise system across the board at all 10 hospitals concurrently...
Enterprise Data Warehouse Initiatives - It's not just the implementation of technology by itself. And when you change a business process, technologists don't really do that, business managers do that. It's very important that you have executive support, not just financially but the active involvement of executives. And in gaining that support, it also allows you to truly understand, measure and communicate the impact and the benefits of what they have agreed to do, the technologists agreed to do and the business process users either internally or externally are changing...
InetSoft Approach to What-If Analysis Dashboards - InetSoft's what-if analysis feature assists analysts in quantifying uncertainty in causal relationships and optimizing resource allocation while guiding decisions. InetSoft's StyleBI is a comprehensive, real-time, analytical reporting and dashboard software solution used at thousands of enterprises worldwide...
Shared Bookmarks in Dashboard - Shared bookmarks are a way of taking annotations even further. Annotations allow users to leave notes for their colleagues, but bookmarks allow users to share data. InetSoft's approach to bookmarks is a bit different than the traditional "I'll come back to this later" approach that Web browsers take. Bookmarks in StyleBI allow users to share snapshots of their data with others...