An Enterprise BI Charting Tool for Your Business
A BI charting tool can help you map your data, making it easier to understand and act on. Implemented correctly, a BI charting tool can help you make better decisions.How Minor Decisions Make a Major Impact
Smarter decisions lead companies to larger profits, better leads, and an inspired work ethic. Making good decisions about your business is not a skill that comes naturally. You need help; help in the form of evidence that empirically proves that the choice you're about to make is the right one.
By visualizing the facts, you can clearly interpret trends in the data to make your decision much easier. Last quarter you served pizza in the cafeteria for the first time and profits were up 32%. This quarter, you stopped serving pizza and profits are back to normal.
Pizza doesn't equal profits... or does it? Not if you think about it in a vacuum. However, with this data directly in front of you, it's a no-brainer to bring back the pizza next quarter!

Fully Customizable Charting API
Pick from a predefined chart library, or create something completely new
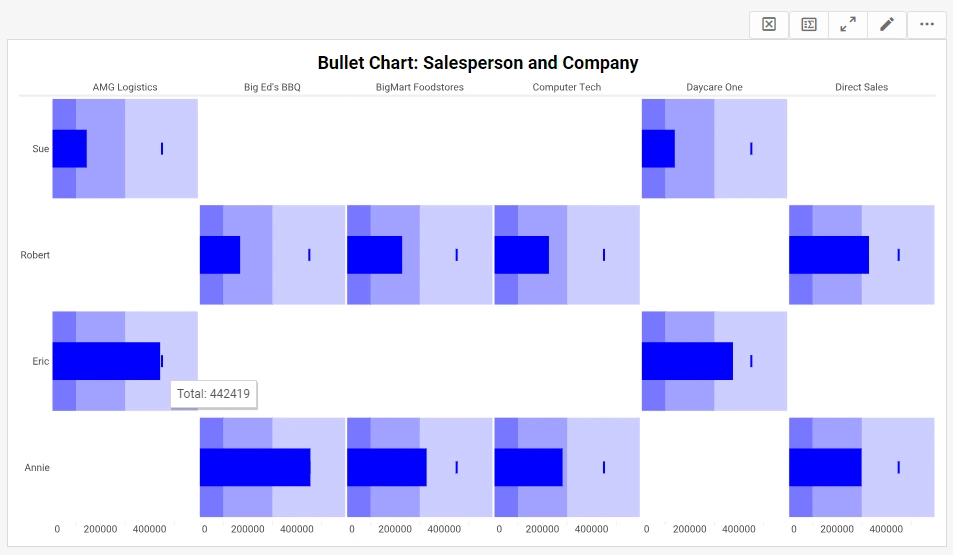
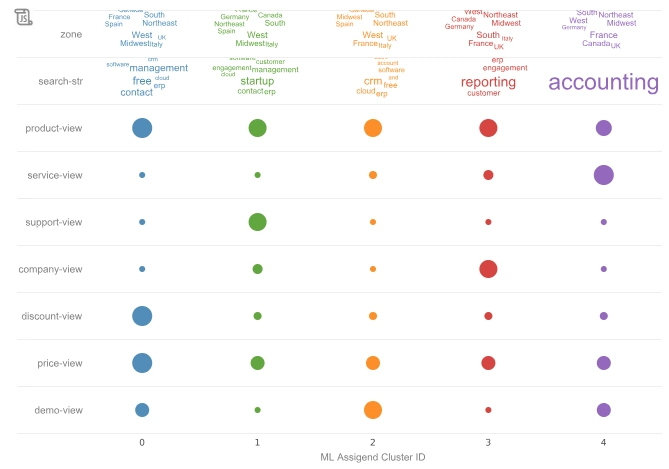
InetSoft's leading BI solution, StyleBI, comes equipped out-of-the box with a substantial selection of ready-to-go charts. For you more technically savvy users, however, a dynamic charting engine enables you to shape your charts from the ground up. Click here to see a gallery of charts created using this engine. To the right is a heat map. In addition, radial, waterfall, and candlestick are other examples of advanced chart types that are available.
Visual Analytics
An edition of StyleBI, focusing on data exploration, visual analysis, and data mashup
Style Scope utilizes a unique, patent pending Data Block technology that enables data mashup in a Lego-like fashion. IT create performance tuned and security controlled data blocks that can be transformed and assembled by business users for real-time business questions. These real-time reporting options allow for quick and informed business decisions.
Visualized analysis is constructed in real-time by dropping data items into visual elements such as charts, metrics, and selections. The resulting visualizations reveal the intrinsic relationships among data and allow for easy apprehension of multidimensional data.
How a BI Charting Tool Is Used by a The Management of a Telemedicine Platform
Telemedicine platforms have become increasingly integral in modern healthcare delivery, offering remote consultations, diagnosis, and treatment options. To ensure the effectiveness, efficiency, and quality of these platforms, various key performance indicators (KPIs) and metrics are tracked and analyzed. These metrics provide valuable insights into the platform's performance, user experience, clinical outcomes, and overall impact on healthcare delivery. Let's delve into some of the essential KPIs and metrics that telemedicine platforms commonly track and analyze:
-
Number of Consultations: This KPI tracks the total number of consultations conducted on the telemedicine platform within a specific timeframe. It provides insights into platform utilization and demand for remote healthcare services.
-
Consultation Duration: This metric measures the average duration of each consultation, including the time spent by healthcare providers and patients interacting on the platform. Analyzing consultation duration helps in optimizing scheduling, resource allocation, and efficiency of care delivery.
-
Wait Time: Wait time refers to the time elapsed between a patient's request for consultation and the initiation of the virtual visit with a healthcare provider. Minimizing wait time is crucial for enhancing patient satisfaction and access to timely care.
-
Patient Satisfaction Scores: Patient satisfaction scores capture feedback from patients regarding their experience with the telemedicine platform, including ease of use, quality of care, and overall satisfaction. High satisfaction scores indicate a positive user experience and effective service delivery.
-
Provider Availability: This metric measures the availability of healthcare providers on the telemedicine platform to conduct consultations. Monitoring provider availability ensures adequate coverage and timely access to care for patients.
-
Appointment Scheduling Efficiency: Appointment scheduling efficiency assesses the ease and speed of scheduling virtual appointments on the telemedicine platform. Streamlining the scheduling process enhances patient convenience and reduces administrative burden.
-
Patient Retention Rate: Patient retention rate measures the percentage of patients who continue to use the telemedicine platform for ongoing healthcare needs. High patient retention indicates the platform's value, reliability, and effectiveness in meeting patient expectations.
-
Clinical Outcomes: Clinical outcomes metrics evaluate the impact of telemedicine interventions on patient health outcomes, such as symptom improvement, disease management, and treatment adherence. Tracking clinical outcomes demonstrates the effectiveness of virtual care delivery in achieving positive health outcomes.
-
Diagnostic Accuracy: Diagnostic accuracy measures the precision and reliability of remote diagnosis made by healthcare providers through the telemedicine platform. Ensuring high diagnostic accuracy is essential for maintaining patient safety and confidence in virtual consultations.
-
Medication Adherence: Medication adherence metrics assess patients' adherence to prescribed medications and treatment plans following virtual consultations. Monitoring medication adherence helps in identifying and addressing barriers to treatment compliance.
-
Cost Savings: Cost savings metrics quantify the financial savings achieved through the use of telemedicine, including reduced healthcare costs, fewer hospital admissions, and lower transportation expenses for patients. Demonstrating cost savings is critical for healthcare organizations and payers evaluating the return on investment in telemedicine initiatives.
-
Geographic Reach: Geographic reach measures the extent to which the telemedicine platform expands access to healthcare services in underserved or remote areas. Analyzing geographic reach helps in identifying areas with limited access to traditional healthcare facilities and targeting interventions accordingly.
-
Technology Performance: Technology performance metrics evaluate the reliability, speed, and functionality of the telemedicine platform's technical infrastructure, including video conferencing capabilities, data security measures, and system uptime. Monitoring technology performance ensures a seamless and secure user experience for both patients and providers.
-
Compliance with Regulatory Standards: Compliance with regulatory standards assesses the telemedicine platform's adherence to legal and regulatory requirements, such as patient privacy laws (e.g., HIPAA compliance), licensure regulations for healthcare providers, and reimbursement policies. Ensuring compliance mitigates legal risks and promotes trust and confidence among users.
-
Data Security Incidents: Data security incident metrics track the frequency and severity of cybersecurity breaches or data breaches affecting the telemedicine platform. Protecting patient health information and sensitive data is paramount for maintaining trust and confidentiality in virtual healthcare delivery.

More Articles About BI Charting
15 Key Performance Indicators (KPIs) That Are Specific to the Insurance Industry - Quote rates are fundamental in an industry where speed and exceptional service can make or break the business. A quote is usually a potential client's first interaction with an insurance company, so it must be accurate and sent timeously. A quote rate looks at how many quotes an insurance broker compiled and supplied compared to the number of leads they contacted...
Common Vocabulary Around Data - We apply the same principles of a normal manufacturing supply chain to data, and the advantage of that is that executives speak that language. As we discuss supply chains, we are really establishing a common vocabulary around data that executives can understand. The advantage of that is that executives will be more likely to fund the data, more likely to support enterprise data, more likely to pay for the business intelligence tools around data that we need in order to manage it. So it's actually a really effective expectations management tool...
Perplexing Aspects of Governed Data Integration - While governed data integration may seem straightforward, it can actually be quite complex. There are many factors to consider, including data quality, security, and privacy. In addition, there may be legal or regulatory requirements that must be taken into account. One of the most perplexing aspects of governed data integration is data quality. When data is being combined from multiple sources, it is essential that the data is accurate, complete, and consistent. This requires careful planning and execution to ensure that data is properly cleansed, deduplicated, and standardized...
Why Is It So Important To Establish A Sound State Of Governance? - And data governance is something we’ve been hearing about a lot as a starting point for customer data integration, master data management, or other kinds of data management projects. Why is it so important to establish a sound state of governance before getting started on those kinds of programs...