InetSoft's Business Intelligence Software for Mac OS X
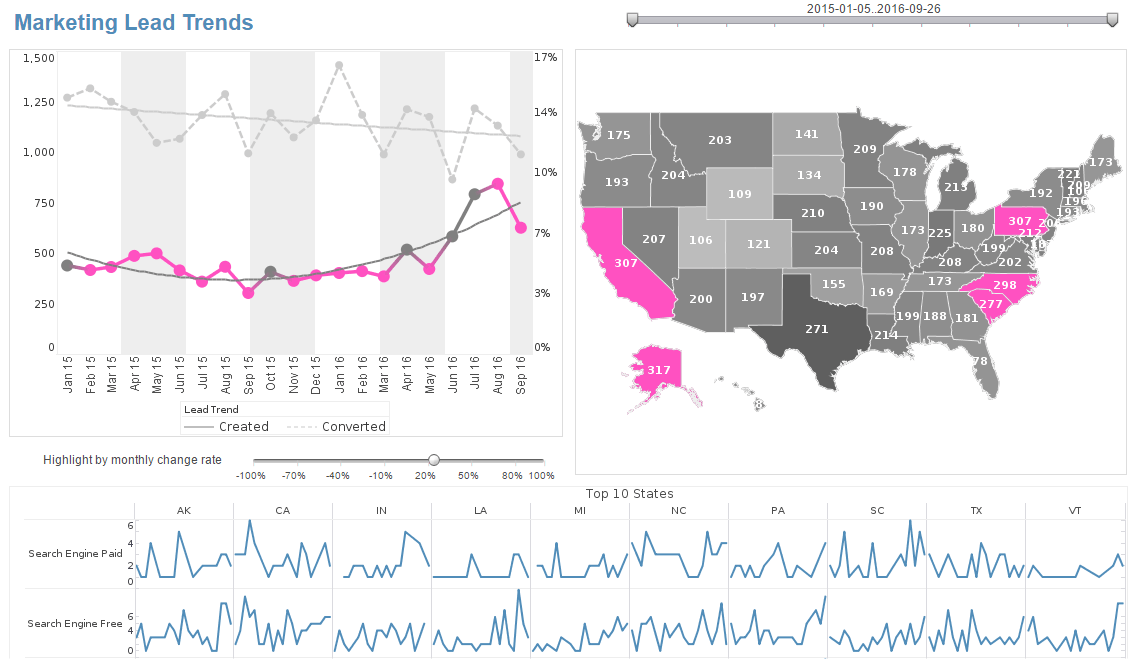
Are you researching BI solutions for your organization's Apple Mac machines? Deploy a small-footprint, easy-to-use Java-based business intelligence application from InetSoft. As an innovator in reporting software since 1996, InetSoft has pioneered the evolution from static reporting towards interactive visualization of data via dashboards.
InetSoft's award-winning software has been deployed at thousands of organizations worldwide and integrated into dozens of other application providers' solutions serving vertical and horizontal markets of their own.
Try a free test drive copy of StyleBI, InetSoft's all-inclusive business intelligence software platform that includes the reporting application, Style Report Enterprise, and the dashboard application, Style Scope.
Why StyleBI Is Ideal for Mac OS X Users
Native-friendly deployment via Docker and web UI
StyleBI delivers a browser-based interface and a compact Docker container that runs smoothly on macOS via Docker Desktop. Mac users avoid the common friction of Windows-only desktop clients because everything is accessible through a standards-compliant browser. Running a local container for development or proof-of-concept is straightforward on MacBooks and iMacs, letting data teams prototype dashboards locally without spinning up large cloud environments or Windows virtual machines.
Smooth performance on modern Mac hardware
Modern Mac hardware—especially Apple Silicon—excels at handling single-node, containerized workloads and browser-rendered visualizations. StyleBI’s lightweight runtime and efficient rendering make interactive dashboards responsive on MacBook Pros, enabling complex visual interactions, map overlays, and drilldowns without the lag that heavier in-memory engines sometimes exhibit on desktop clients. Users get fluid interactions even when working with moderately large datasets.
Seamless developer experience for macOS-based teams
Product and engineering teams that develop on macOS benefit from StyleBI’s REST APIs, JavaScript hooks, and CSS-style theming. These tools integrate naturally into macOS development workflows—editors, terminal, and local web servers—so embedding dashboards into native Mac-targeted electron apps or web-based SaaS products is efficient. Developers can script content management, automate dashboard provisioning, and debug integrations using familiar macOS tools.
Browser-agnostic compatibility and macOS browsers
StyleBI’s visualizations are designed to work across modern browsers, including Safari and Chrome on macOS. This reduces cross-platform inconsistencies and minimizes support tickets tied to browser differences. Users can rely on Safari’s energy-efficient rendering and Chrome’s developer tools for inspecting and tuning embedded dashboards, which streamlines troubleshooting and optimization on Mac devices.
Lightweight admin tasks for Mac-hosted demos and POCs
Mac-based BI architects and sales engineers can host demonstration instances locally for customer workshops using a single Docker container. Admin tasks—installing, upgrading, backing up configuration—are simpler on macOS thanks to CLI tools and container tooling familiar to Mac developers. This enables rapid, low-cost proofs of concept without enterprise-grade infrastructure or Windows servers.
Integrated Mac-friendly security and SSO
StyleBI supports standard identity protocols and can integrate with SSO systems commonly used in macOS environments, including OAuth providers and enterprise identity services. Combined with macOS network security features and managed VPNs, StyleBI lets IT teams enforce secure access policies while maintaining a native user experience for Mac desktops and laptops.
Design and UX consistency on macOS
Because dashboards are embedded via HTML, CSS, and JavaScript, designers can create analytics experiences that match macOS application styling and typography. This produces a cohesive user experience when analytics are surfaced inside native-like apps or web portals accessed from Mac devices. The ability to apply CSS-style theming ensures analytics feel integrated rather than tacked on.
Reduced need for virtualization and cross-platform workarounds
Mac teams often resort to virtual machines or remote desktops for Windows-only BI tools. StyleBI’s web-first model eliminates that requirement, removing the overhead of managing VMs and improving productivity. Teams save time and reduce complexity by running and developing directly on macOS, while still delivering enterprise-grade analytics to a mixed-device user base.
