What is the Definition of Key Metrics?
A metric is a quantifiable measure that is used to track and assess an aspect of business performance. Metrics are utilized to track the progress made towards both short and long-term goals.
Each industry and department has it's own particular metrics. For example, in finance, metrics such as MRR or customer acquisition cost are tracked.
Executive teams use metrics such as annual recurring revenue and customer lifetime value to help them not miss the forest on account of the trees. Marketing departments track metrics related to engagement and their lead pipelines. Sales teams track opportunities to measure the percentage won, lost, and deferred.


Metrics vs. Key Metrics Meaning
The most important metrics that a business tracks are called key metrics. Also known as a key performance indicator, or KPI, a key metric is a statistic which, by its value gives a measure of an organization or department's overall health and performance. KPIs, or key performance indicators, are vital metrics connected to time sensitive goals. All organizations, from nonprofits to multinational corporations, need to track key metrics in order to have an accurate picture of what is going on. Simply looking at key metrics can give a reading of an organization that would otherwise require sophisticated analysis of large amounts of data.
The way to property utilize business metrics is to compare them to industry benchmarks or goals set by the company. Benchmarks provide essential context against which the metric's performance can be measured. For example, sales numbers that would be considered high for a small to medium sized business might be considered absolutely dismal if they come from a large major corporation.
The context provided by benchmarks are what separate metrics from key performance indicators. While business metrics measure performance in all aspects or an organization, KPIs measure progress towards a vital business goal.
Business Metrics Examples
Every kind of organization has specific key metrics that it uses to track performance. Education organizations track dropout rates, attendance, and the student/teacher ratio. Emergency service companies measure metrics like response time, percentage of false alarms, etc. In addition to industry-specific key metrics, individual departments within an organization track metrics specific to their managerial goals.
A marketing department tracks KPI's such as conversion rates, value, and customer profitability. Supply chain managers often track inventory turnover, average order lead time, and out-of-stock performance. Metrics tracked by HR often include average training time, employee turnover, and average training cost per employee.
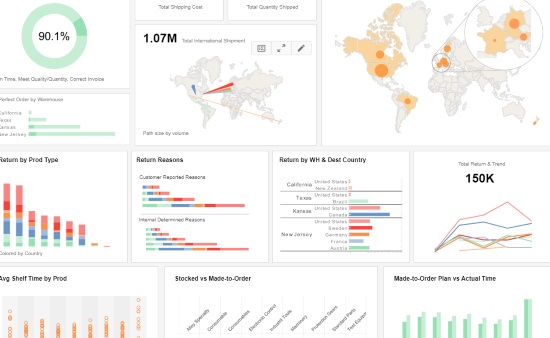

Performance Metrics Example Dashboard
This education dashboard was created using StyleBI, InetSoft's flagship BI application. The most crucial metrics are total applications, admission rate, and total enrollment. These key metrics are displayed visually as large highlighted text. The small comparison KPIs right below make it easy to compare these key metrics against benchmarks, in this case, figures for the previous years. The other sections of the dashboard go into further detail on these key metrics. Different student distributions are shown as bar charts broken down into individual years. An administrator could also use StyleBI's drill-down capabilities to view details and slice-and-dice.
Metrics of Performance in Different Industries
As shown in the previous examples given, different types of companies and departments track different kinds of metrics. This next section details the key metrics for various departments and industries.
Sales Metrics
Sales teams, rely on data to make decisions and form strategies just as marketing teams do. Metrics cover the monitoring of the sales pipeline, and comparing sales to qualified leads.
Sales is extremely competitive, so measuring ROI on efforts is essential.. Here are the most common sales metrics no sales team should neglect:
- Won Opportunities -the number of closed won sales opportunities.
- Revenue - all income generated through a business's operations.
- MRR Growth Rate - the rate at which Monthly Recurring Revenue is growing.
- Leads - the total number of individuals who have shown interest in the product or service.
- Lead to Win Rate - the percentage of leads who become customers.

Finance Metrics
Revenue, keeps companies alive, so measuring revenue is a core function of any finance department. Financial metrics are of interest outside the finance team however. Customers, stakeholders, and potential investors will also want to know about an organization's financial health.
Here are the most vital financial metrics for monitoring and tracking the health of an organization:
- Net Profit - what remains after all expenses are deducted from income.
- Revenue - all income generated through a business's operations.
- Current Ratio - current assets compared to current liabilities.
- Net Burn - the amount a business's cash reserves lose in one month.
- Gross Margin - gross profit as a percentage of total revenue.
Marketing Metrics
Marketing metrics are a vital way for marketing teams to measure the effectiveness of marketing campaigns, whether those campaigns be seo, paid search, email, or social media.
Marketing is a data-driven practice that stretches across various tools and platform, and the metrics tracked will depend on the tools and environments used. Here are a few examples of key marketing metrics:
- Lead Conversion Rate - the percentage of website visitors who are captured as leads.
- Average Time on Page - average amount of time a user spends on a single website page.
- Customer Acquisition Cost - average amount of money spent on sales and marketing to acquire a single customer.
- Return on Marketing Investment - how much revenue a marketing campaign generates relative to the cost of running the campaign
- Marketing Qualified Leads - measures the quality of leads that are passed on to the sales department.
Social Media Metrics
Social media metrics track performance and engagement on platforms such as Twitter, Facebook, TikTok, or Instagram.
Social media marketing is a fundamental aspect of any web marketing strategy. Social media marketing campaigns drive traffic to your website, help generate leads, and increases brand awareness.
With so many platforms to monitor, it can be challenging to measure performance across them all. Here are five key metrics you can track across all social media channels:
- Followers - the number of social media users who have chosen to follow a company's account.
- Account Reach - the number of unique users that have viewed a post or ad by a social media account.
- Post Engagement Rate - the number of interactions with a social media post compared to the total number of followers.
- Comments - the number of comments on a social media post or ad.
- Video Views - the number of times a video posted is viewed.
SaaS Metrics
SaaS (software as a service) providers closely monitor the metrics that track customer retention, revenue, and user engagement. Here are five examples of SaaS metrics:
- Churn - the percentage of subscribers to a service that discontinue their subscription.
- Daily Active Users - number of unique users that have interacted with the software in a day.
- Monthly Active Users - number of unique users that have interacted with the software in a month.
- Monthly Recurring Revenue (MRR) - total subscription revenue acquired in a month.
- Customer Retention Rate - number of customers retained from one period to the next.
- Customer Lifetime Value (LTV) - the total revenue a business can expect from a single customer.
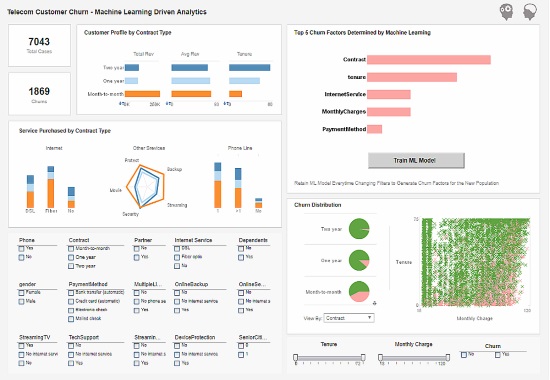
Key Metrics and Machine Learning(ML)
Traditionally, key metrics are defined out of business experience by humans. The data-based definition of key metrics has become feasible with advances in machine learning. For example, it might not be apparent what key factors are affecting employee turnover. Traditionally human-defined key metrics such as job satisfaction surveys and compensation parity alone are not sufficient to explain retention performance. Machine learning can use data to find additional key metrics that HR should analyze and monitor. Would you like to start a project to explore this?
Contact Us for a ML & Key Metrics Project
How Key Metrics Help You Grow Your Business?
Metrics help you identify areas where your business needs improvement. By tracking these metrics, you can see whether your efforts are paying off. This allows you to make adjustments as needed. If you're not using metrics to measure your business, then you're missing out on an opportunity to improve your business. Metrics allow you to track the progress of your business by measuring different aspects of your business. They also provide insight into how your business is doing.