InetSoft's ActiveCampaign Dashboards
Searching for the best dashboard for your ActiveCampaign data? ActiveCampaign is a cloud software platform for small-to-mid-sized business that combines marketing automation with traditional CRM. InetSoft's StyleBI includes a custom web connector for integrating your ActiveCampaign data. In order to increase revenue, a company must foster effective marketing strategies based on the CRM reports and end initiatives that are performing poorly. However, in order to do that it is critical to have an application implemented that allows for the easy understanding and interpretation of the CRM data.
For years, InetSoft has been a leader in providing businesses with easy to use, flexible, and versatile dashboard reporting software compatible with almost any CRM application. With the combination of compelling visuals, interactive reports, and a user-friendly drag-and-drop interface, business users can create and analyze data on a whole new level in order to spot new trends, increase efficiency, and even decrease overall costs.

InetSoft's Approach to ActiveCampaign Dashboards
What makes InetSoft stand out from the rest as an application for creating intuitive customer management dashboards from CRM data?
The advantages of using InetSoft Technology's StyleBI in conjunction with your business' CRM software is the versatility it offers. StyleBI is compatible with many different CRM applications whether having open connectivity databases via ODBC, such as SugarCRM, to more proprietary database types, including Siebel CRM and salesforce.com. InetSoft's technology design is also customized to support other software such as Infusionsoft, InTouch CRM, and Rapportive.
InetSoft combines ease of use with the capabilities to create powerful, efficient CRM software dashboards in order to interpret and interact with data in a new way. Using DataBlock technology, users can easily drag and drop blocks of data onto the dashboard to create compelling graphs, charts, crosstabs, and more. With maximum self-service capabilities, users can create visuals so meet any business queries, explore new trends, and increase efficiency.
InetSoft also offers data mashup technology, which allows users to combine CRM data with any other data source, such as Google Analytics and Adwords Data. Users can integrate data from previously disparate sources to discover new correlations in data in just a few simple steps, allowing for maximum exploration of data.
Email Marketing Performance Dashboard
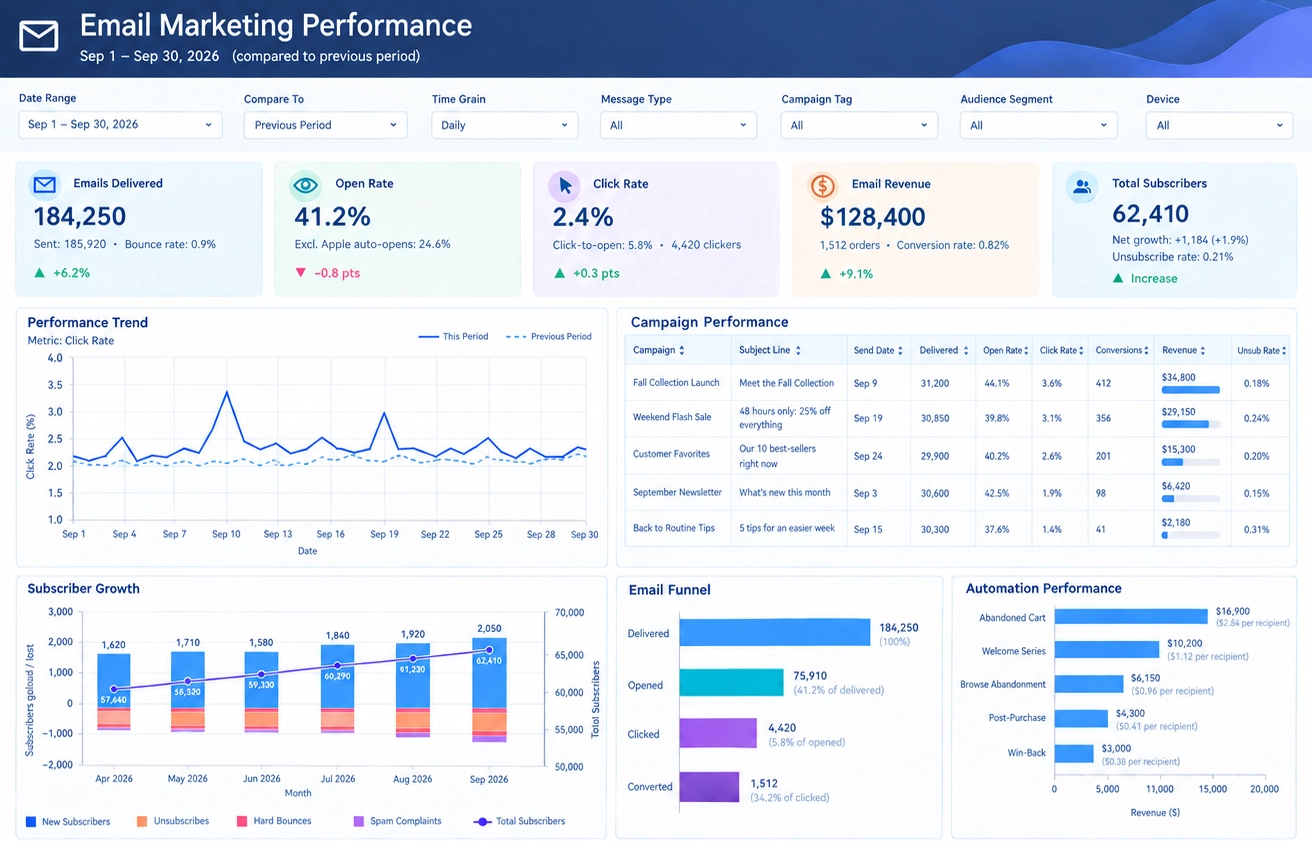
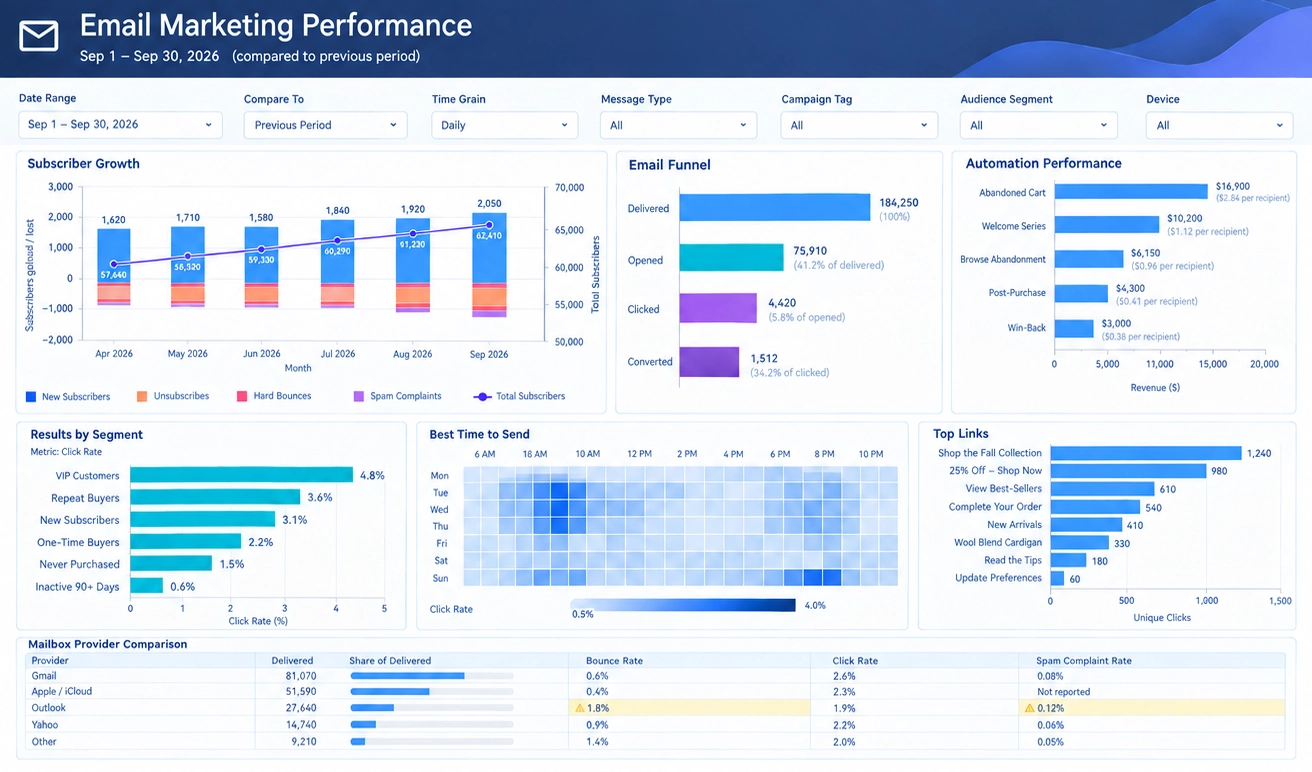
An Email Marketing Performance Dashboard provides marketing teams with a complete view of campaign effectiveness, subscriber engagement, email deliverability, and revenue contribution. Instead of reviewing multiple reports from separate email platforms, marketers can monitor all critical metrics from a single dashboard. The dashboard shown here summarizes campaign activity across a monthly reporting period and compares results against previous performance to identify trends, opportunities, and potential issues.
At the top of the dashboard are several filtering options that allow users to analyze results from different perspectives. Filters such as date range, comparison period, time grain, message type, campaign tag, audience segment, and device type make it easy to drill into specific campaigns or audiences. Marketing managers can move between executive-level summaries and detailed operational analytics without creating new reports.
Subscriber Growth Analysis
One of the most important sections of the dashboard is the Subscriber Growth chart. This visualization tracks how the email list changes over time by displaying new subscribers, unsubscribes, hard bounces, spam complaints, and total subscribers. Subscriber growth is a key indicator of audience health because an expanding list creates more opportunities for future engagement and conversions.
The chart shows steady growth in new subscribers over several months, while tracking subscriber losses caused by unsubscribes and deliverability issues. Marketing teams can quickly determine whether list growth is sustainable or whether increasing unsubscribe rates are reducing campaign effectiveness. The total subscriber trend line helps executives understand the long-term trajectory of the email program and evaluate whether audience-building initiatives are succeeding.
Monitoring subscriber growth also helps identify the impact of promotions, content strategies, and acquisition campaigns. If a particular month experiences a spike in subscribers, marketers can investigate which campaigns generated the strongest results and replicate those tactics in future efforts.
Email Funnel Performance
The Email Funnel section provides a clear picture of how recipients move through the engagement process. The funnel begins with delivered emails and progresses through opens, clicks, and ultimately conversions. Each stage represents a key step in the customer journey and helps marketers understand where engagement is strongest and where prospects are dropping off.
A large delivered count indicates successful email delivery, while open rates reveal how effective subject lines and sender reputation are at attracting attention. Click rates measure how compelling the email content and calls-to-action are. Finally, conversion metrics demonstrate whether campaigns successfully drive desired business outcomes such as purchases, registrations, downloads, or inquiries.
By examining conversion percentages between each funnel stage, marketers can identify bottlenecks that limit campaign performance. For example, strong delivery but weak opens may indicate a need to improve subject line strategy. Strong opens but weak clicks may suggest that email content requires optimization.
Automation Performance
The Automation Performance section measures revenue generated by automated email workflows. Examples include abandoned cart campaigns, welcome series programs, browse abandonment sequences, post-purchase communications, and re-engagement campaigns.
Automated campaigns often deliver some of the highest returns within an email marketing program because they target customers based on specific behaviors. The dashboard compares revenue generated by each automation and also calculates revenue per recipient. These metrics help marketing teams prioritize investment in workflows that consistently generate value.
If an abandoned cart campaign significantly outperforms other automations, additional testing and optimization efforts can be focused on expanding that success. Likewise, underperforming workflows can be reviewed and redesigned to improve engagement and revenue outcomes.
Audience Segment Analysis
Different customer groups respond differently to email marketing efforts. The Results by Segment section compares engagement metrics across audience categories such as VIP customers, repeat buyers, new subscribers, one-time buyers, inactive customers, and prospects who have never purchased.
Segment-level analysis helps organizations create more personalized marketing strategies. High-value customers may demonstrate significantly stronger click rates and conversion rates than other groups. Understanding these differences allows marketers to tailor content, offers, and messaging to each audience's preferences and behaviors.
Personalization is one of the most effective drivers of email performance, and segment reporting ensures that marketing decisions are based on actual customer behavior rather than assumptions.
Best Time to Send
The Best Time to Send heat map provides insight into when subscribers are most likely to engage with emails. The visualization compares click-rate performance across days of the week and hours of the day. Darker colors indicate time periods with stronger engagement.
Send-time optimization can significantly improve campaign effectiveness. Rather than scheduling emails based on convenience, marketers can use data to determine the optimal delivery windows. If engagement consistently peaks on weekday mornings or weekend evenings, future campaigns can be scheduled accordingly.
This analysis helps organizations maximize the impact of each campaign without increasing marketing spend. Small improvements in timing can generate meaningful gains in opens, clicks, and conversions.
Top Links Performance
The Top Links section identifies the most frequently clicked links within email campaigns. Popular product pages, promotional offers, educational content, and customer service resources can all be ranked according to unique click activity.
Understanding which links attract the greatest attention provides valuable insight into subscriber interests. Marketing teams can use these findings to guide future content creation, promotional planning, and product merchandising strategies. Strong performance for a specific product category may support additional campaigns focused on that area.
Click analysis also reveals whether important calls-to-action are receiving adequate visibility. If strategic links generate limited engagement, layout changes or messaging adjustments may be necessary.
Mailbox Provider Comparison
The Mailbox Provider Comparison section tracks performance across major email providers such as Gmail, Outlook, Yahoo, Apple Mail, and others. Metrics include delivered messages, share of delivered volume, bounce rate, click rate, and spam complaint rate.
Deliverability monitoring is essential for protecting sender reputation and maximizing campaign reach. Elevated bounce rates or spam complaint rates can signal issues that require immediate attention. Comparing provider performance helps marketers identify technical problems that may only affect specific mailbox services.
For example, if Outlook users demonstrate lower engagement or higher bounce rates than Gmail users, the organization can investigate authentication settings, inbox placement issues, or content rendering problems.
Business Value
An Email Marketing Performance Dashboard transforms raw campaign data into actionable intelligence. Marketing leaders can monitor subscriber growth, measure funnel effectiveness, evaluate automated campaign performance, optimize send times, analyze audience engagement, and track deliverability from a single interface.
With comprehensive visibility into email operations, organizations can improve targeting, increase engagement, boost conversions, and maximize marketing return on investment. By combining operational metrics with revenue performance indicators, the dashboard serves as both a management tool and a strategic decision-support system for modern email marketing programs.
About InetSoft
Since 1996 InetSoft has been delivering easy, agile, and robust business intelligence software that makes it possible for organizations and solution providers of all sizes to deploy or embed full-featured business intelligence solutions. Application highlights include visually-compelling and interactive dashboards that ensure greater end-user adoption plus pixel-perfect report generation, scheduling, and bursting. InetSoft's patent pending Data Block™ technology enables productive reuse of queries and a unique capability for end-user defined data mashup.
This capability combined with efficient information access enabled by InetSoft's visual analysis technologies allows maximum self-service that benefits the average business user, the IT administrator, and the developer. InetSoft was rated #1 in Butler Analytics Business Analytics Yearbook, and InetSoft's BI solutions have been deployed at over 3,000 organizations worldwide, including 25% of Fortune 500 companies, spanning all types of industries.
