Mobile BI Solutions for the iPad and iPhone
Are you looking for a mobile BI solution that supports iPads and iPhones? InetSoft offers business intelligence software for dashboards, reporting and mashups that can be accessed from desktops, laptops and all types of mobile devices. The server application can be easily deployed and used. View a demo and read customer reviews. Articles below discuss various topics of interest in the business intelligence market.
Software for Data Analysis - In order to optimize the use of resources, software for data analysis helps gain a larger picture of what's going on.. The right tool saves a lot of time for business managers and helps prevents mistakes that come from relying on educated guesses. When software makes data analysis easy, it allows decision-makers to see patterns and trends that they would not have found by looking through records manually. Proper implementation enables smart choices. InetSoft Technology provides excellent software for data analysis, giving businesses the tools and resources to analyze data and organize their reporting into a single source. InetSoft's software gives specific, customized insights without requiring advanced IT skills. This independence from IT involvement will give more people in your organization the ability to find get the answers they need, when they need them...
Solution for Corporate Level BI - Looking for a corporate level BI solution? InetSoft is a pioneer in self-service BI server software that can run in the cloud or on premise. View a demo and try interactive examples...
Some Alternatives for Periscope BI Tool - Are you looking for a good alternative to Periscope's BI tool? InetSoft's pioneering dashboard reporting application produces great-looking web-based dashboards with an easy-to-use drag-and-drop designer. Maximize self-service for all types of users. No dedicated BI developer required. InetSoft's solution is true Software-as-a-Service for hosted and self-hosting, not a combination of client developer tools and a web-based delivery platform. All new clients and partners get free one-on-one business intelligence expert help to accelerate deployment. View a demo and try interactive examples...
Spreadsheets Google BI Dashboards - Are you looking for a better solution for business intellignce dashboards for Google Sheets? InetSoft, a pioneer in dashboard reporting, offers the ability to mash up your Google Sheets data with almost any other data source, cloud-based or on premise. The easy to use drag-and-drop designer helps you build a dashboard in minutes. Any dashboard is shareable with full control over access permissions by user or role. Continue reading below to learn more about InetSoft's solution for Google Sheets. Charts are the easiest to understand visualization tool, and InetSoft offers many choices. Tables, as spreadsheets have demonstrated, can pack information in their special ways. InetSoft offers extremely flexible tables that can embed sophisticated inter-cell calculations. Beyond charts and tables, many other familiar user interface components are equally useful in a dashboard setting. InetSoft treats all these components as first class citizens. That gives each component extensive functionality of its own...

Spread Marts Aren't The Answer For Self-Service BI - So spread marts aren’t the answer for self-service BI. What are some of the alternatives that customers can look at? Many end users would greatly benefit from ad hoc analysis tools, and what’s ad hoc? So rather than putting the load on IT to create more reports or modify the reports constantly, you give the users the power to tap into your wealth of data. But you do this within the context of data governance, and that’s a fancy way of saying that end users can play with the data, but IT still controls who sees what. And it lessens the issue of IT staff being the perceived bottleneck and gives the business users a way to answer their own questions. This speeds up the whole process and allows you to operate at the speed of business. Okay. Let us look at some examples of this interactive business intelligence. It would be great to see how quickly and easily an end user can answer their own question. I’ve opened up a Web browser to take a look at a report. Now I can create a report in the browser, create a new query in the browser, or simply modify it. And if we think about that use case where someone is shifting their business priorities or changing things as they go through the quarter, maybe something that was interesting a week ago is something that they need to see get some new data on today...
State Department BI Example - The State Department is tasked with carrying out the foreign policy of the United States as laid out by President and Congress. This requires the department to have a deep knowledge of policy and politics around the world, from foreign conflicts to matters of migration, terrorism, political unrest, natural disasters, drugs, climate, etc., and to track and analyze data from dozens of regions on an ongoing basis. Business intelligence can help in making sense of the vast quantities of data collected by the State Department. For example, the Humanitarian Information Unit (HIU) produces reports on crisis situations around the word, such as the drought situation in Africa (https://hiu.state.gov/#AF,U2609). The graphic illustrates typical map-based business intelligence output, using color to code dimensions and measures, and inset charts and graphics (including donut charts) to highlight areas of particular interest to the reader.
Supercharging BI with Spark, Easy Machine Learning - Ever since the creation of the Apache Hadoop project more than 10 years ago, many attempts have been made to adapt it for data visualization and analysis. The original Hadoop project consisted of two main components, the MapReduce computation framework and the HDFS distributed file system. Other projects based on the Hadoop platform soon followed. The most notable was Apache Hive which added a relational database-like layer on Hadoop. Together with a JDBC driver, it had the potential to turn Hadoop into a Big Data solution for data analysis applications. Unfortunately, MapReduce was designed as a batch system, where communication between cluster nodes was based on files, job scheduling was geared towards batch jobs, and latency of up to a few minutes is quite acceptable. Since Hive used MapReduce as the query execution layer, it was not a viable solution for interactive analytics, where sub-second response time is required...
State of the Art BI - To us, a state of the art BI solution is one that can analyze and explore massive amounts of data, providing actionable insights at a competitive price. In order for your organization to get the full benefit from your data, all departments should be able to access and explore data relationships, enabling better business decisions....
Strong Responsive Customer Support BI Vendors - When organizations evaluate business intelligence (BI) platforms, they often focus on features such as dashboards, data integration, scalability, and AI-driven analytics. But one factor consistently shapes long-term success more than any other: responsive customer support. Even the most powerful BI software becomes frustrating if support is slow, unhelpful, or inconsistent. BI platforms connect to multiple data sources, serve users with varying technical skills, and often power critical reporting workflows. When issues arise, teams need fast, knowledgeable assistance to avoid downtime and maintain momentum. Analyst reports and user review platforms consistently show that support responsiveness is a major differentiator among BI vendors. For example, PeerSpot’s 2026 comparison of Microsoft Power BI, Tableau Enterprise, and Zoho Analytics highlights customer service sentiment scores of 6.6 for Power BI, 6.1 for Tableau, and 5.4 for Zoho Analytics—indicating meaningful differences in responsiveness and expertise . Meanwhile, Gartner Peer Insights ratings show InetSoft scoring 4.8 out of 5 in Service & Support, one of the highest support ratings among BI vendors.
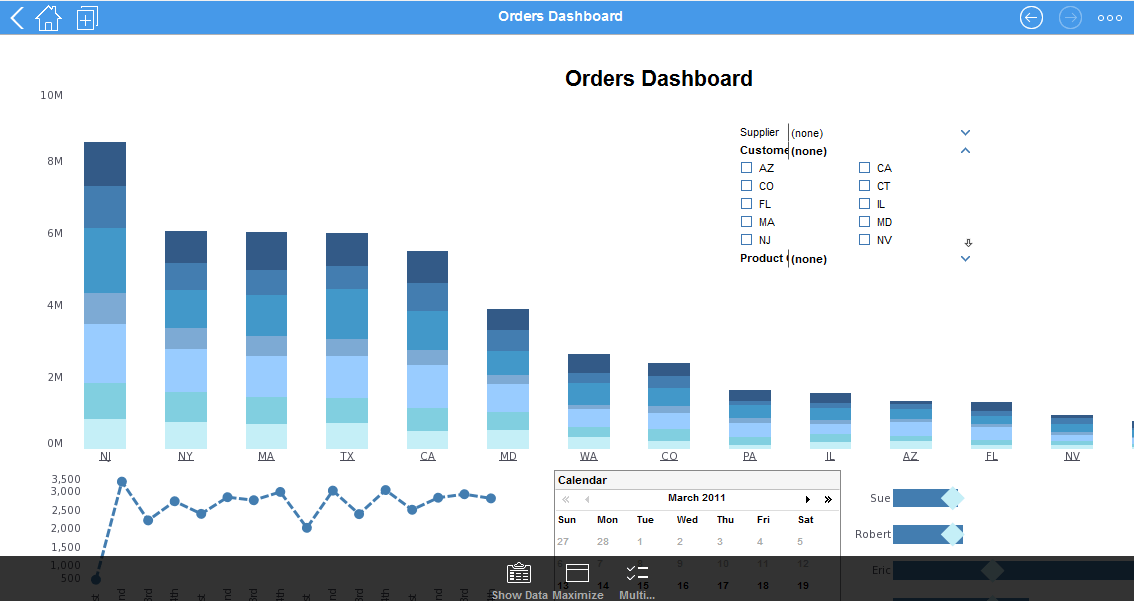
Tablets, Not Smart Phones Are Pushing Mobile BI - Tablets, not smart phones, are becoming the primary deployment platform for business intelligence at many organizations due to their ease of use, their popularity among the executive set and the perceived boost that they give to productivity of the on-the-go workers. Thanks to tablet PCs, you’re not restricted to hauling a laptop to meetings, you can simply slide out your lightweight tablet, take notes via touch-screen technology, zoom in and out of graphs to focus on more information. Business users are already starting to get value from these devices. They have changed the way they work. This appears to be a fundamental paradigm shift. Tablet devices can turn the typical IT data request from “get me the information” to “I will get the information myself as long as I can get to it from my tablet.” And the more people in the organization that are getting their own information, the more they use the information for decision making...

Tableau Like BI Tools - Looking for good BI tools like Tableau? InetSoft's pioneering dashboard reporting application produces great-looking web-based analytics with an easy-to-use drag-and-drop designer. Mash up virtually any data source, cloud-based and on-premise. Give maximum self-service to all types of users. View a demo and try interactive examples...
Tech Consultancy Griffin-Schruers Adopts InetSoft's StyleBI for Client Dashboards and Reporting - InetSoft Technology, a pioneer in data intelligence, analytics, and reporting, announced that tech consultancy Griffin-Schruers has decided to use InetSoft's StyleBI to provide their clients with dashboards and automated reporting...
The role of business intelligence (BI) in the digital age -Business intelligence is centered around the strategies and software that forward-thinking companies use for robust data analysis across every key function, process, and department. BI solutions offer historical, real-time, and predictive data visualizations that ultimately improve 'in the moment' decision-making, strategic planning, and internal collaboration. Business intelligence helps users to dig deeper into relevant data while connecting with trends, patterns, or correlations they would have otherwise missed..

Tips on Transitioning into Operational BI - InetSoft presents to you a special webinar on the challenges operational business intelligence presents and way's to smoothly transition into it. We are here today to talk about operational business intelligence, or BI, what also people call enterprise intelligence. We certainly see more and more companies finding a critical role for BI in their day-to-day decision making, and this isn't just in their strategic planning as it may have been in the past. The technology needed to support this new form of BI is ready today, but it appears that the hardest part of enterprise intelligence may be the so-called soft issues, the areas that many listeners may not have considered. Let’s talk a little bit about the different kinds of BI? I think most people are probably familiar with strategic business intelligence. That’s been around a long time. That was the early kind, and it’s still very popular today. It is the type of business intelligence that we have been implementing forever. These are the more historical analytics achieving long-term organizational goals by looking at trends and patterns, multidimensional analysis and so forth. The data is typically anywhere from a day to a week to a month to even the year or more in terms of its age...
Today’s BI Tools Are Very Flexible - Today’s BI tools are very flexible, and there are now modeling techniques and tools that are flexible and aimed at end users. You don’t need a statistics degree or be a SAS expert. SAS is not something a typical end user can use. And access from anywhere, anytime is really important. So if you wrap this up, there is a lot of buzz out there. There is also a lot of confusion. I think the summary is that the word that keep coming out is this is faster, flexible and iterative on the development side, and there are techniques from extreme programming, proven techniques that can be used to do that. And I think being iterative is really important. We see that a lot that you can’t really know the end result until you get reaction from the end users. But they have trouble reacting to it until they see something. So those first points, faster, flexible iterative are key. Then for the end user, easy access to data, intuitive, accessible anywhere. So from the technology side, it’s about these kinds of things. And there is a lot of writing on it. Scrum, extreme programming, iterative mobility, if your organization is not doing these things, there is a bunch of seminars, there are classes, there is a bunch of writing that can help. Here at InetSoft, we weren’t doing scrum and extreme programming a couple of years ago. We had traditional development cycles, and they would take 7 to 9 months with the QA testing on the end...
Tools to Simplify the Building of BI Applications - Using tools and processes, this primarily means tools to simplify the building of the BI application, that will make the process easier for these organizations and their users. They need to assess what data types they’re going to integrate. I think there’s still plenty of opportunity to pick and choose from data types that you could more easily support and incorporate. But ultimately you do want to have a plan in place as to what data types you have to support in the long run. Identifying the systems that the information has to work with, I think that you’re essentially doing that in bringing the information together via data mashup. Their existing capabilities might be inadequate, and I still think that would be a big challenge. And we talked a little bit about how you analyze this unstructured information, so you can give the context to the unstructured data, the number of occurrences and the word counts and things like that. You can go even deeper, I don’t think it would be your first step necessarily but people do things like sentiment analysis on text...

Top 10 Dashboard Tools - In the world of business intelligence, what would qualify as a 'top 10' dashboard tool? With so many new dashboard tools and BI solution systems, it can become a headache searching for the right solution for your organization. At InetSoft, we simplify the problem for you, plus more. Since 1996, InetSoft has been transcending BI solutions for organizations of all sizes. By carefully considering a business user's point of view, we incorporate tools that only help maximize your organization's effectiveness. What makes InetSoft's dashboard tool so intuitive and powerful is the multitude of features and options, easy-to-use interface, and integration with some of our other products like reporting tools, analytics software, and access to almost any data source...
Top Business Intelligence Tools - Business intelligence tools consist of a multitude of different applications designed to gather, interpret, and relay data. These applications typically read data that has been previously stored in some sort of data warehouse or data mart.The proper set of business intelligence tools empower an organization's entire staff. IT is given new insight into business operations. Sales are welcomed into a bright new world of increased possibility with the advent of BI tools for CRM software. Finance and accounting professionals will find it much simpler to keep track of data. All business users, and subsequently the business itself, greatly benefit from a solid amalgamation of top business intelligence tools...
Understanding Changes from Operational BI - A drastic change into operational BI can become hard work and strenuous to your organization. It is best to understand that changes that happen going into operational BI. Just understanding how a customer service rep or a sales representative or something like that, how do they go about doing their job, is key. Employees are very different today than they were 10, 20 years ago. A lot of them are very mobile. They may even be virtual workers. So we need to understand how they interface with the technologies, for example, do they now use the Internet or Intranet? Do we need to create portals and dashboards that bring together the operational data as well as the operational BI results? How will this be used to create this business solution that’s needed by the users. So these are the good questions to be asking. How will the operational BI solution itself integrate with the existing business solutions through this dashboard or this portal? For example, if we have a customer relationship management system already in place, for example like Siebel or something, it’s heavily being used by our customer service reps. Now we need to understand well, how will these operational BI applications integrate with that CRM system? Where are the hooks? Where is the interface? Where does it work together...

Usage of Mobile BI to Grow - This allows for new scenarios for usage of mobile BI to grow. Users no longer need to be connected to a specific solution as they did before. For example, now retail floor personnel customizing an order for a specific car can go stay on the floor while working on this job. The same goes for some a sales consultant who needs to look into some new designs and specifically alter it on the go. A production manager for example and an inventory manager standing in the warehouse can analyze in real time the analytics and forecast to determine what would be the optimum storage and shipping plans for one off many compelling -- these are one of many compelling applications that drive usage of tablets in the business intelligence world. Users are already getting value out of these devices. They have changed the way they work. It's a fundamental paradigm shift. The ability of two people to look at the same data on the same device is key here...
Using BI as a Competitive Differentiator - Organizations are now using information and business intelligence as a key competitive differentiator, because everything else in our world has already become or definitely is on the way to becoming a commodity. So it's becoming harder and harder to compete on the quality or the features of products and services. So enterprises more and more are competing on information. If two competitive enterprises are selling exactly the same product or promoting the same service, but one of the enterprises has a better insight into what its customers are doing, how they are behaving, what they are buying, what they like, what they dislike, then which enterprise do you think is going to win in this environment? Those are the kinds of the major trends that we see in the market. The other side of the story is that until we do reach, as I call it, nirvana of a single enterprise software and application stack where you would be running all of your applications, your ERP application, your CRM applications, your finance applications, trading, risk, supply chain, your databases, your operating system software, et cetera, on a single software stack - which I don’t think is something that is going to happen in the near future - business intelligence will remain the glue that will bring it altogether...
Using Google Maps in a BI Dashboard or Visualization - InetSoft's business intelligence dashboarding software lets you chart data on a Google map for interactive data visualizatons. Using the Google map API and InetSoft's script language, you can request a static map from Google to be the background of the chart you design in InetSoft's StyleBI application. Then you can plot your geocoded data from almost any data source based on latitude and longitude. Add to your interactive dashboard selection lists, range sliders and a calendar selector, and you can build an efficient way to explore data in relation to geographic features such as as streets, buildings, and terrain features. This gives you the ability to visualize data on a very local basis when using the standard boundary map files that come with InetSoft's charting engine and plotting data based on postal code or region isn't sufficient...

Using Our BI Tool's Database Write Back Feature - Dastur: Are there any questions about using our BI tool’s database write back feature? Flaherty: Yes, Jay we do have a couple of questions that we might as well take right here. Let’s look. Okay, the first one is can I write back to LOBs in an Oracle database? Dastur: LOBs, Large Objects? Flaherty: Yes. Dastur: Yes, the write-back is basically an API. So when you make changes you can actually encapsulate your own business rules, and you can write back not only to a database, you can write back to a text file. You can write into an API or a Web service. So there is this layer in between where you can detect what's been changed, and you can decide how you want to update stuff. Flaherty: And then I guess there is a related question following about CLOBs and BLOBs? Dastur: If it's a character LOB, yes, then it probably makes more sense, if it's like an image I don’t know how we use it with edit and image, but yeah if it's a character large objects, yeah you should be able to modify them...
Using StyleBI for Complex Transformation Logic in the BI Layer - In many organizations, complex transformation logic still lives in a patchwork of SQL scripts, legacy ETL tools, and Excel workbooks. That makes analytics brittle, hard to govern, and slow to change. StyleBI takes a different approach: it brings a full data transformation pipeline directly into the BI layer, so you can centralize business logic where it is designed, governed, and reused alongside dashboards and reports. Instead of treating data preparation as a separate, upstream project, StyleBI lets you model joins, aggregations, calculations, and data quality rules inside a governed semantic layer and visual transformation flows. The result is a BI environment where complex logic is explicit, versionable, and reusable—without forcing every change through a data warehouse team. Traditional BI stacks push most transformation logic into ETL or ELT pipelines. That works for stable, slowly changing requirements, but it breaks down when business questions evolve weekly. Moving transformation logic into StyleBI’s BI layer offers several advantages...