Researching Software for Data Analysis?
In order to optimize the use of resources, software for data analysis helps gain a larger picture of what's going on. The right tool saves a lot of time for business managers and helps prevents mistakes that come from relying on educated guesses.
When software makes data analysis easy, it allows decision-makers to see patterns and trends that they would not have found by looking through records manually. Proper implementation enables smart choices.
InetSoft Technology provides excellent software for data analysis, giving businesses the tools and resources to analyze data and organize their reporting into a single source. InetSoft's software gives specific, customized insights without requiring advanced IT skills.
This independence from IT involvement will give more people in your organization the ability to find get the answers they need, when they need them.


What Makes InetSoft Easy-to-Learn Data Analysis Software?
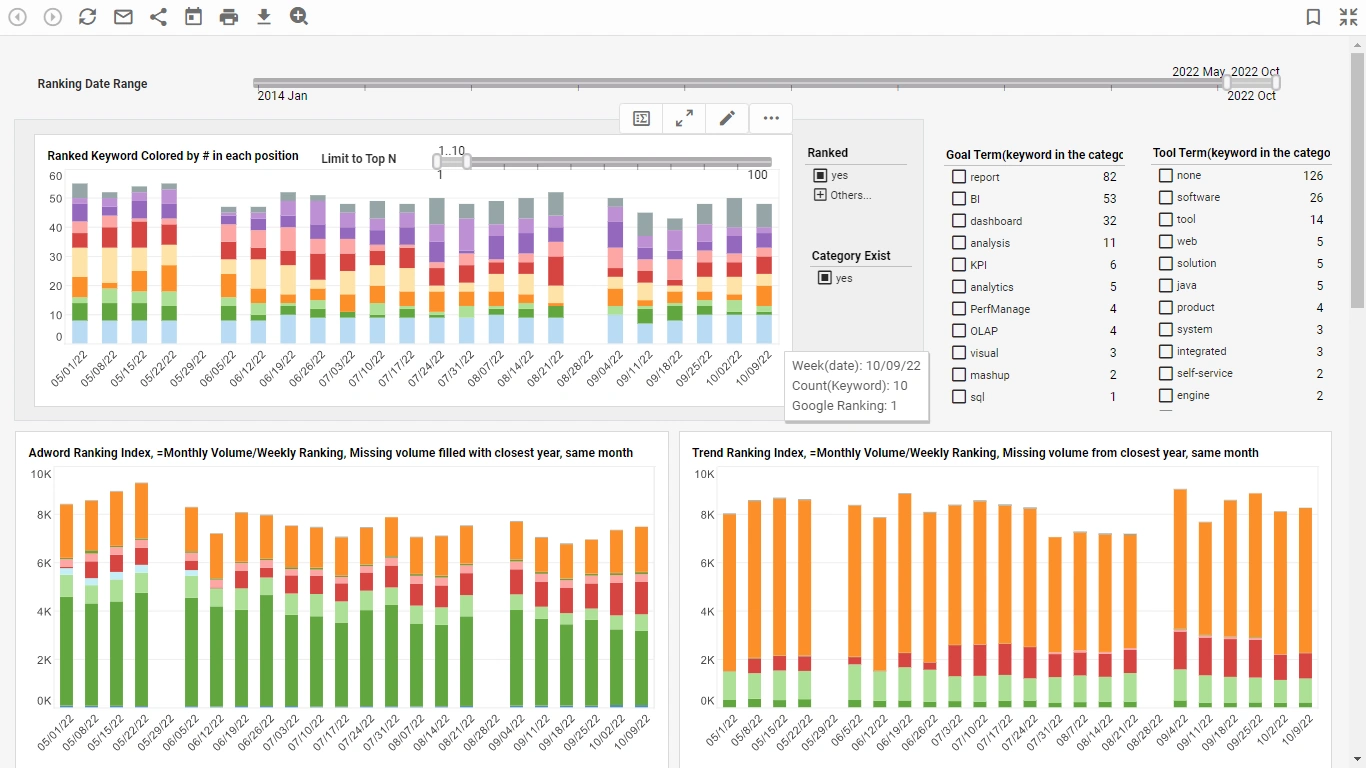
InetSoft software for data analysis allows users to cut down time spent on performing analysis. Many companies have data in multiple forms in multiple places, and either have to perform separate analyses for different sources, or manually combine the data. But now in the BI industry, the concept of “data mashup”, which was pioneered by InetSoft, is becoming more popular. Data mashups allow for the combination of data sources without relying on a middle step of ETL and data warehousing.
Through InetSoft’s drag-and-drop data worksheet, the end user does not have to worry about what goes on behind the scenes. They can focus on gaining insights from what the software presents to them, enabling faster learning. Through InetSoft’s BI platform, end users are able to create their own data mashups and build analytical reports and visualizations from them. This allows for users to not only bring in their own data and combine it with established data sources, but to also combine data tables that had not yet been mapped together.
Other InetSoft Features
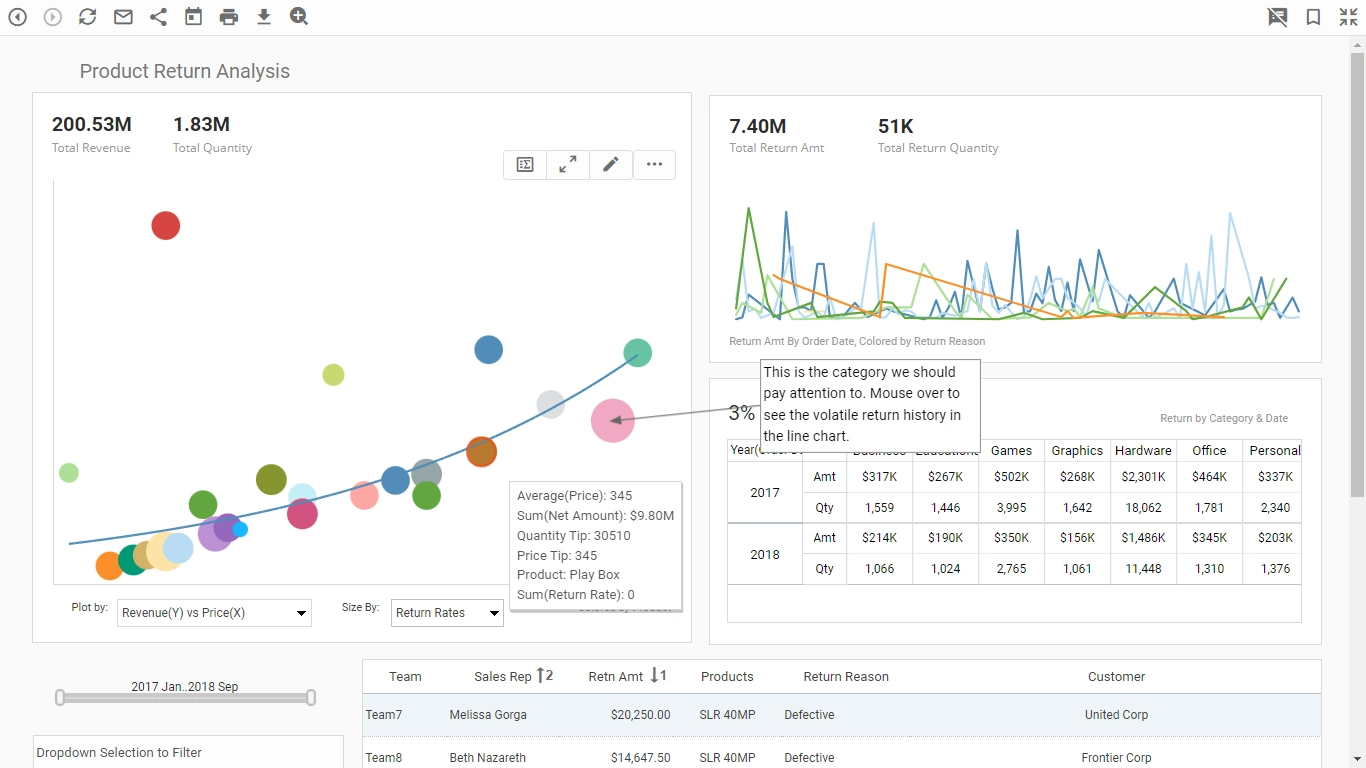
In addition to data mashups, users can also build their own analytical dashboards through a simple drag-and-drop tool, constructing automatically generated KPI’s and visually organizing dashboard elements according to their preference. Performing even complex analyses without having to code SQL or any other language makes the InetSoft tool easy to work with for data explorers of any skill level. Another convenient aspect of the software is that InetSoft's BI can run on any operating system including Windows, Linux, Solaris, HP Unix, and Mac OS.
Data exploration is further enhanced with features such as brushing. The brushing tool highlights a specific subset of data across all charts on a dashboard, providing a different angle to view, seeing how the selected data breaks down among different categories.
With data exploration, the tool you’re using makes all the difference. With InetSoft's software for data analysis, powerful data mashups, reports, and interactive dashboards are easy to establish and analyze, for faster answers, and better decisions.

What Kind of Data Analyses Do Chemical Manufacturing Companies Do?
Chemical manufacturing companies engage in a wide range of data analyses to optimize their processes, ensure product quality, manage resources efficiently, and make informed business decisions. Here are several types of data analyses commonly performed in the chemical manufacturing industry:
-
Process Optimization:
- Statistical Process Control (SPC): Monitors and controls manufacturing processes by analyzing data in real-time, ensuring that variations stay within acceptable limits.
- Six Sigma Analysis: Aims to minimize defects and variations in production processes to improve efficiency and quality.
- Quality Control:
- Chemical Analysis: Involves the use of analytical techniques to verify the composition and purity of raw materials, intermediates, and final products.
- Quality Assurance (QA): Analyzing data to ensure that products meet specified quality standards and regulatory requirements.
- Supply Chain Management:
- Demand Forecasting: Uses historical data and predictive analytics to estimate future product demand, helping companies optimize inventory levels.
- Logistics Optimization: Analyzing transportation and distribution data to enhance efficiency in the supply chain.
- Energy Management:
- Energy Consumption Analysis: Identifying areas of high energy consumption and implementing measures to reduce energy usage, which can lead to cost savings and environmental benefits.
- Environmental Monitoring:
- Emissions Tracking: Analyzing data related to emissions and waste to ensure compliance with environmental regulations and to implement sustainable practices.
- Safety Analysis:
- Incident Data Analysis: Examining data related to safety incidents to identify root causes and implement preventive measures.
- Risk Assessment: Evaluating potential risks associated with various processes and materials.
- Research and Development:
- Experimental Data Analysis: Analyzing experimental results to optimize formulations, improve product performance, and accelerate research and development processes.
- Cost Analysis:
- Cost-Benefit Analysis: Evaluating the costs associated with various production processes and determining the most cost-effective strategies.
- Customer Feedback Analysis:
- Market Research Data: Analyzing customer feedback, market trends, and consumer preferences to adapt products and strategies accordingly.
- Regulatory Compliance:
- Compliance Monitoring: Analyzing data to ensure adherence to various regulatory standards and requirements.

More Articles Related to Data Analysis
Availability and Uptime Metrics - Service Uptime: The proportion of time a service is operational is measured by this KPI. It offers information on the service's dependability and accessibility. Downtime Duration: The length of service outages is measured by this statistic. Analysis of downtime patterns reveals recurrent problems and areas for development...
Dynamic Text for Better Data Insights - One of the key features of InetSoft's fraud management dashboard is the ability to monitor and analyze data in real-time. This can be done through the use of dynamic text, which is text that is hooked up to data sources and updates automatically as new data becomes available. For example, the dashboard could display the number of fake accounts that have been detected, along with a breakdown of these...
Information for On Demand Reports - This is a table of contents of useful product information about InetSoft's reporting software. Ease of deployment and ease of use are the cornerstones of our product development strategy. Read articles below for more details. When it comes to reporting and scorecarding we are also strong there, and the advantage of our platform is its agility...

Job Market Dashboard - The Job Market Monitoring Dashboard below is a mock up example of interactive web-based applications for government agencies that InetSoft offers. With InetSoft's easy-to-use, drag-and-drop design, government officials can quickly build productive analytical tools like this one that aid in day-to-day operations, as well as keep business running smoothly...
Monitoring Dashboard Examples from InetSoft - This page contains monitoring and management dashboard examples from industry pioneer InetSoft's dashboard showcase. InetSoft is top-rated by users on G2 Crowd. Read reviews and register for a personalized demo...
Monitoring Safety of Mining Personnel - One essential aspect of the mining and mining industry as a whole is the safety of personnel. Although it also holds so much importance in other sectors and industries, within the mining industry, it is more than just necessary; it is the top priority. As a part of the strategy to protect the personnel, there are now devices worn on the body provided for them. And the ...
Resources About Corporate Performance Management Software - This is a table of contents of useful product information about, and benefits of, InetSoft's corporate performance management software. With automated risk analysis and lightning-fast loan disbursements, these innovative organizations can now make informed decisions in record time, resulting in reduced risks for all involved...
Stages Of The Performance Management Process - There are several stages of the performance management process. First, the company needs to set its goals. Secondly, it needs to plan and execute the strategies for achieving those goals. Finally, it needs to evaluate the efficiency of the goals and the strategy it has used to get there. Key figures who set the goals and assign tasks to employees are the one who are responsible for performance management...