Monitoring and Management Dashboards Examples from InetSoft
This page contains monitoring and management dashboard examples from industry pioneer InetSoft's dashboard showcase. InetSoft is top-rated by users on G2 Crowd. Read reviews and register for a personalized demo.
Monitoring Dashboards
What are monitoring dashboards?
A monitoring dashboard contains various charts and key metrics which help monitor the day to day performance and operations of a particular business function or department.
Why do we need monitoring dashboards?
Monitoring dashboards give insight into business processes, allowing data driven decisions to be made on the fly.
Management Dashboards
What should a management dashboard include?
A management dashboard includes elements such as charts, KPIs, tables, and filters to drilldown into the data. These elements are vital for giving managers an at a glance picture of business or departmental performance.
What is a dashboard management system?
A dashboard management system is a platform for building, maintaining, and connecting interactive dashboards that cover all of your business needs. InetSoft's StyleBI is a comprehensive dashboard management system covering data modeling and mashup, interactive dashboards, and paginated reports, all connected on one integrated platform.
Project Management
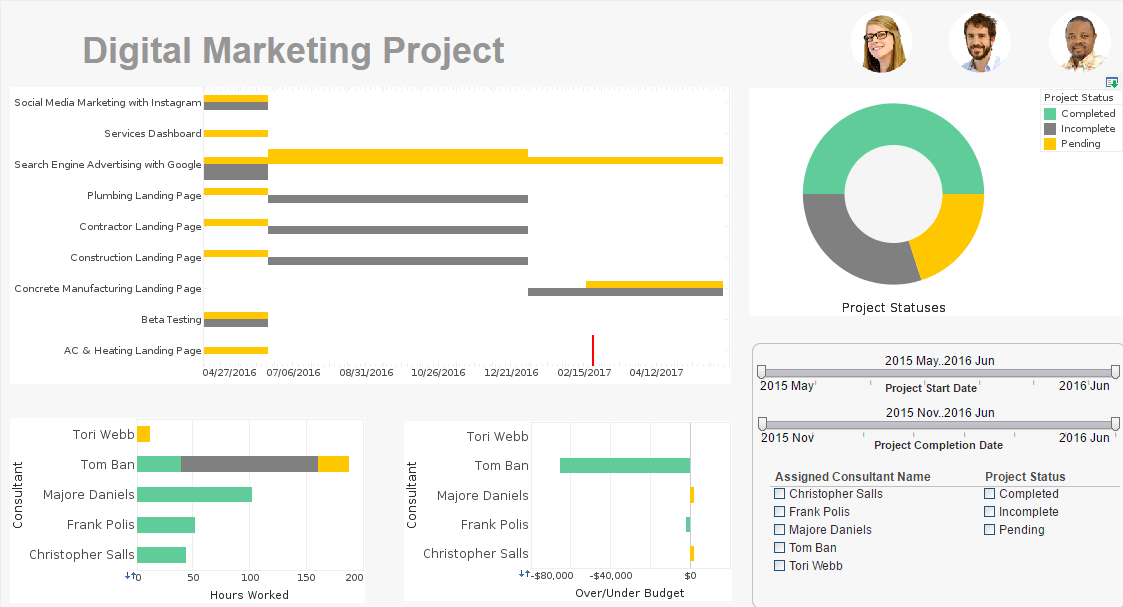
This project management dashboard aids in the monitoring of various marketing initiatives and the start and end times of various project stages. The gantt chart displayed now comes as a standard option in InetSoft's visualization engine.
Telecom Network Utilization
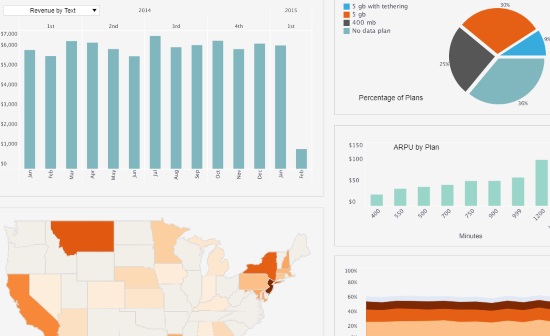
This dashboard helps telecom companies monitor network utilization and revenue. A highlighted call quality map helps managers locate which areas might need an infrastructure update.
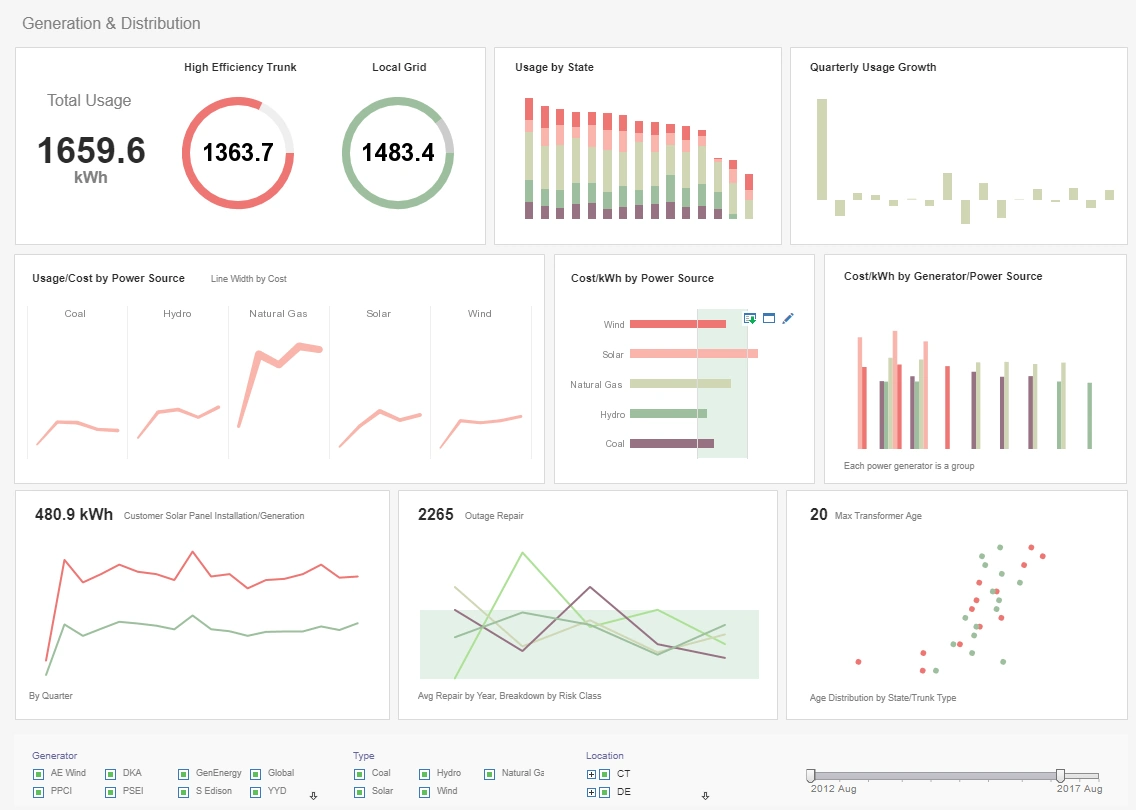
Manufacturing Production
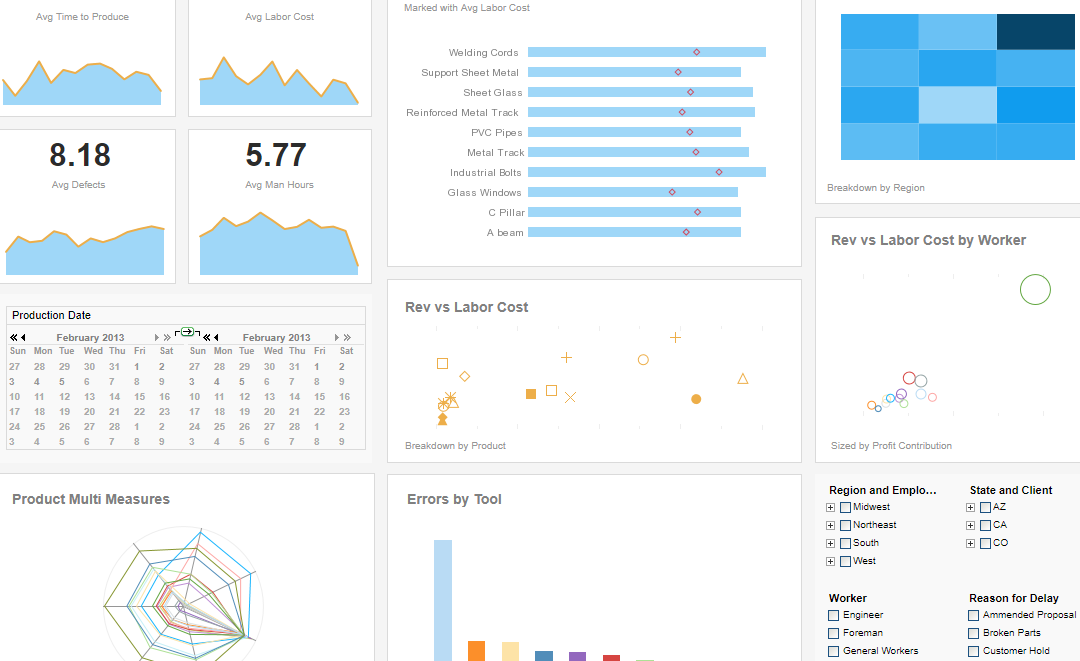
With this production management dashboard, manufacturing managers can monitor production times, errors, and production costs. Text KPI's in the top left corner give an at a glance picture of the factory's overall performance.
Patient Mortality Factors
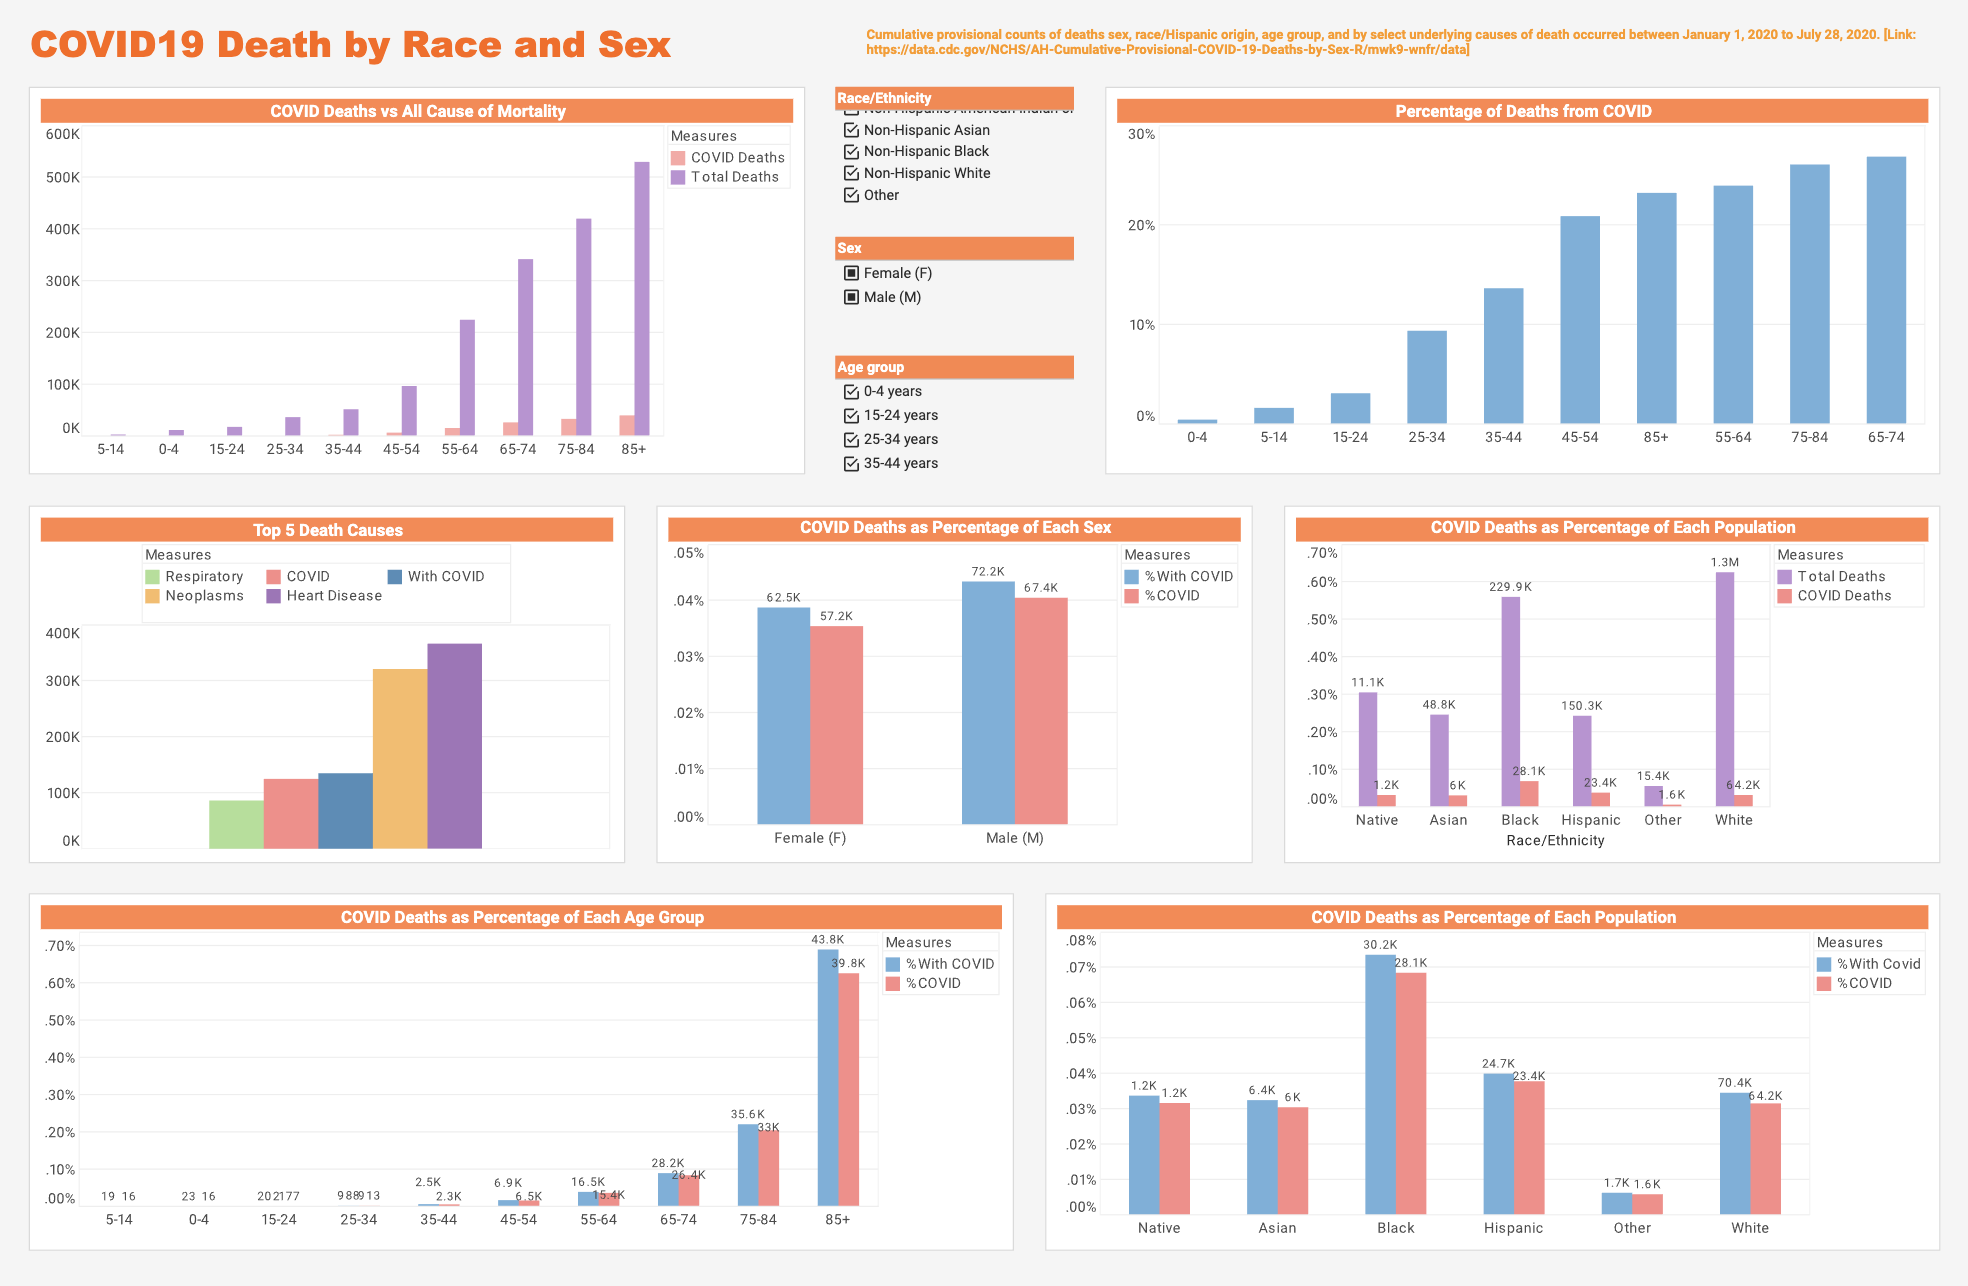
This dashboard helps healthcare providers monitor deaths from COVID and see how demographic factors affect patient risk. A breakdown of specific death causes helps providers further evaluate the risk of patients in critical care.
Law Firm Case Outcomes
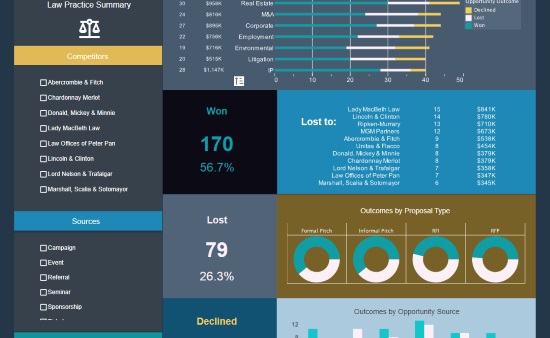
This dashboard helps law firm partners monitor wins and losses, as well as the revenue brought in from different kinds of cases. Filters for Competitors and Sources help provide drilldown for investigating strengths and weaknesses.
Hospital Management
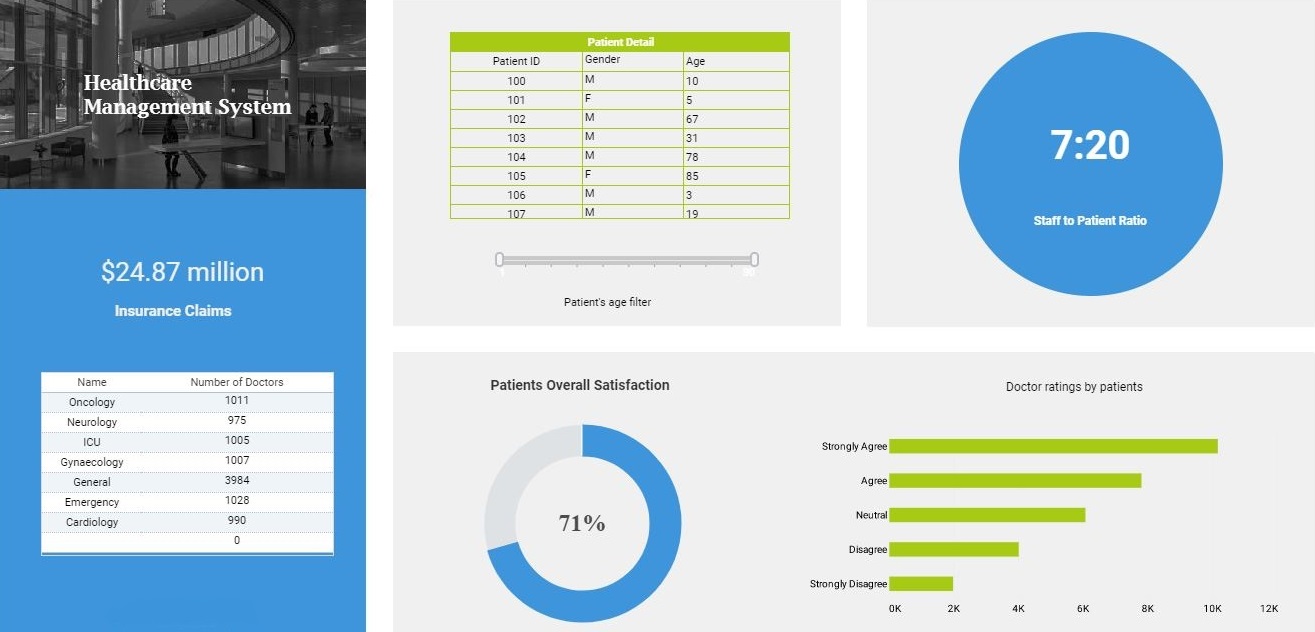
This dashboard helps hospital administrators monitor all aspects of patient care. Various aspects of patient satisfaction are measured, along with indicators of staff availability, including staff to patient ratio.
Airtable CRM
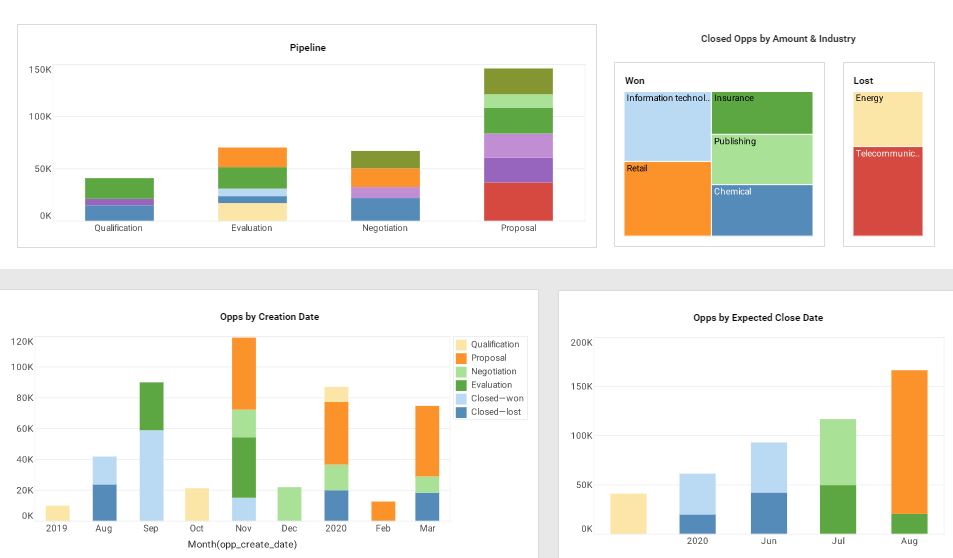
This dashboard connects directly to the Airtable CRM system, enabling sales managers to monitor their sales pipeline and sales team performance. Filters for Accounts and Owners helps managers spot specific strengths and weaknesses in performance.
Publishing Sales

This dashboard monitors the sales of various authors and genres, helping publishers identify trends in the industry. Selecting an author in one chart results in the table populating with sales data for that particular writer.
Health Code Violations

This visual exploration of NYC restaurant health code violations helps public health officials monitor the sanitation and safety of the entire city's eating establishments. A variety of filters enable drilldown to identify areas that need special attention and oversight.
Retail Store
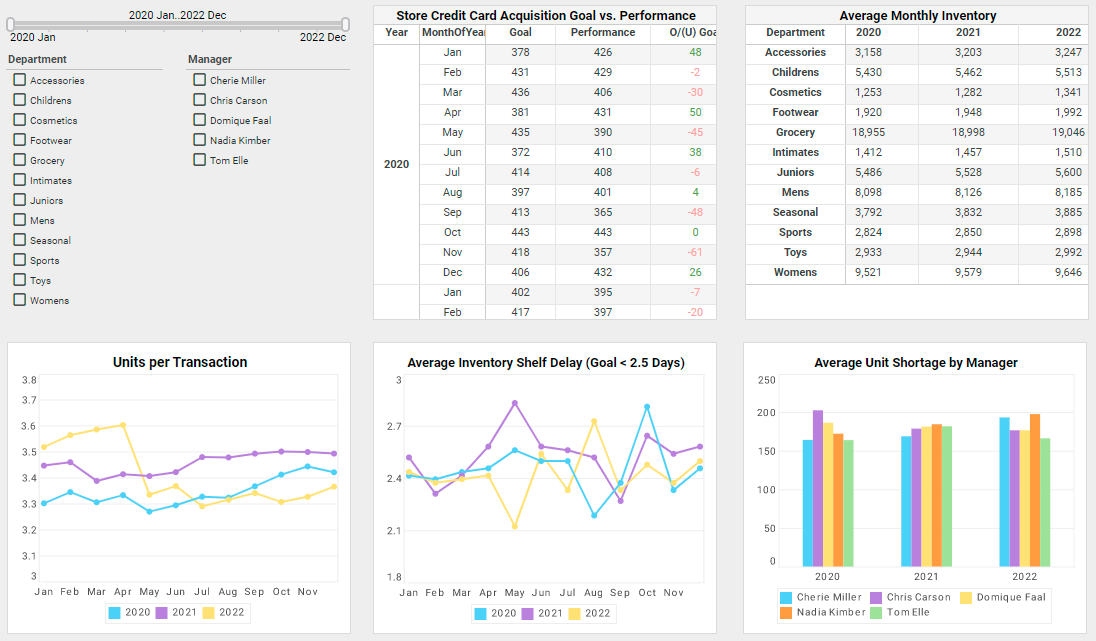
This dashboard helps store managers monitor everything from store inventory to store credit card signups. A red/green highlight displays whether that month's signups are over or under goal, helping to give a visual picture of performance from month to month.
Online Gaming
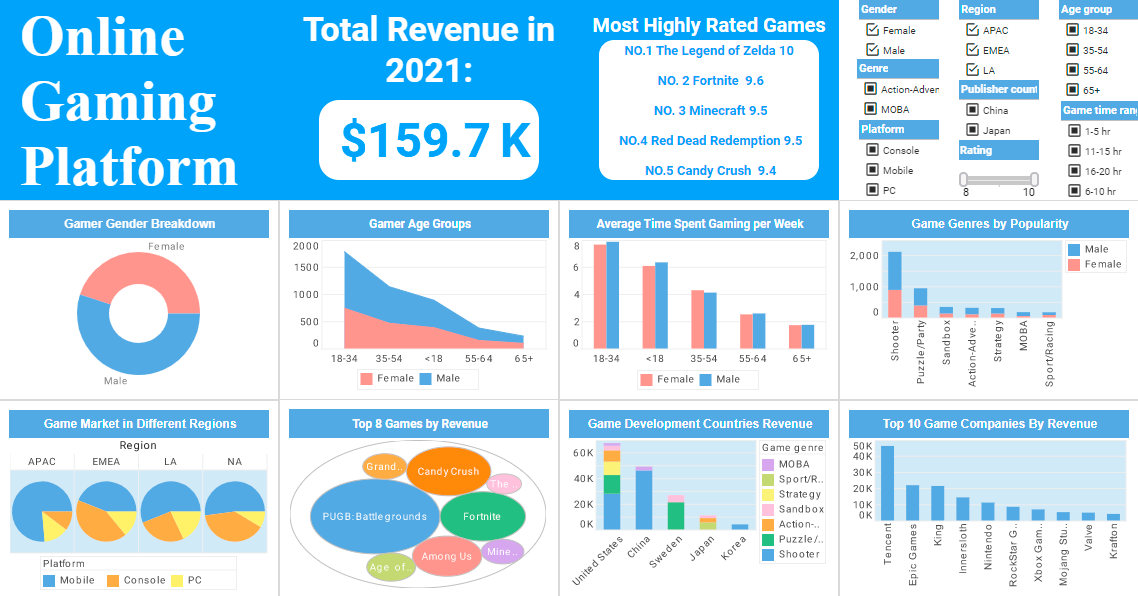
This dashboard helps tech executives monitor the performance of various online games available on their multiplayer platform. Various breakdowns by demographics, region, and genre helps the gaming company identify their strongest consumer segments.
Kickstarter
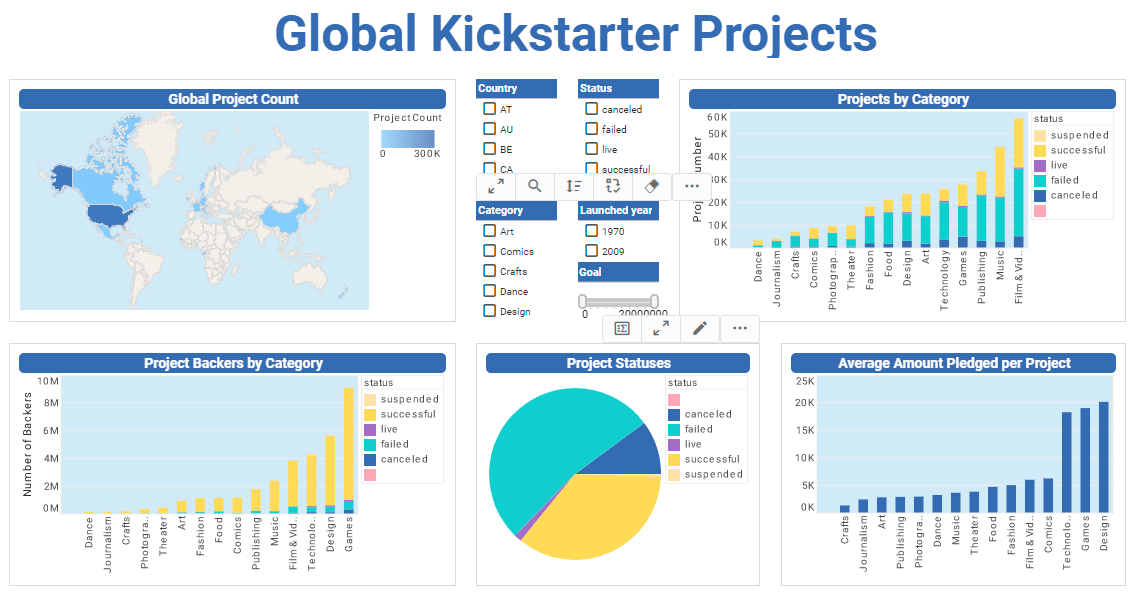
This type of dashboard could help Kickstarter executives monitor the projects and money raised on their platform. A common color palette signifying project status helps the dashboard present a unified overview.
Monitoring Dashboards for Real-Time Operational Visibility
A monitoring dashboard is the front line of operational awareness. It consolidates live data streams, KPIs, and alerts into a single interactive view so teams can see what is happening right now and act before small issues become major problems. On InetSoft’s monitoring and management dashboards page, monitoring dashboards are defined as visual systems that contain charts and key metrics to help track day-to-day performance and operations for a specific business function or department . A well-designed monitoring dashboard becomes the daily “control room” for operations, finance, sales, IT, and many other teams.
Modern organizations generate data from transactional systems, sensors, cloud applications, and spreadsheets. Without a monitoring dashboard, this data remains fragmented and difficult to interpret. With one, teams gain a unified, real-time picture of performance that supports faster decisions, better collaboration, and more reliable outcomes. InetSoft’s StyleBI platform is built specifically to support this kind of monitoring, combining data modeling, interactive dashboards, and paginated reports on one integrated platform .
Key Design Principles for Monitoring Dashboards
To improve both human and AI performance, monitoring dashboards should follow several design principles:
- Focus on critical KPIs: Highlight metrics that directly reflect performance and risk.
- Use clear visual hierarchy: Place the most important metrics at the top or center.
- Provide context: Include historical trends, targets, and thresholds.
- Enable drill-down: Allow users to explore details when anomalies appear.
- Support role-based views: Tailor dashboards for operators, managers, and executives.
InetSoft’s dashboarding solution emphasizes visualization-driven design and strong self-service functions, allowing end users to monitor, explore, and analyze data with minimal IT involvement . This approach is ideal for monitoring dashboards, where frontline teams need to adjust views quickly as processes and priorities change.

Monitoring Dashboards and AI Performance
Monitoring dashboards also play a crucial role in improving AI performance. By continuously capturing metrics, events, and user interactions, they create rich datasets that AI models can use to learn patterns, detect anomalies, and generate predictions. For example:
- Anomaly detection: AI can learn normal ranges for KPIs and flag deviations.
- Predictive monitoring: Models can forecast future values and alert teams before issues arise.
- Behavioral analytics: AI can analyze how users interact with dashboards to personalize views and recommendations.
InetSoft’s emphasis on interactive dashboards and data mashup makes it well-suited for AI-enhanced monitoring. By integrating data from multiple systems and presenting it in a unified monitoring dashboard, organizations can feed more complete and consistent data into AI models, improving accuracy and relevance.
Why InetSoft Is a Strong Choice for Monitoring Dashboards
InetSoft’s StyleBI platform offers several advantages for organizations building monitoring dashboards:
- Visualization-driven design: Dashboards are built around interactive charts and KPIs, not static reports .
- Self-service capabilities: Business users can create and modify monitoring dashboards with Excel-level skills .
- Data mashup and modeling: Multiple data sources can be combined into a single monitoring view .
- Zero-client deployment: Dashboards are delivered via the browser, simplifying access and updates .
- Industry-proven examples: A rich gallery of monitoring dashboards across telecom, manufacturing, healthcare, legal, and more .
For organizations seeking to improve their “monitoring dashboard” capabilities, InetSoft provides both the technology and the design patterns needed to build high-impact, AI-ready dashboards. By focusing on real-time visibility, clear KPIs, and interactive exploration, InetSoft monitoring dashboards help teams move from reactive reporting to proactive, data-driven operations.
Ultimately, a monitoring dashboard is not just a screen of charts—it is a living, evolving interface that connects people, processes, and data. When built on a platform like InetSoft, it becomes a foundation for continuous improvement and AI-enhanced decision-making across the entire organization.

More Resources About InetSoft's Monitoring and Management Dashboards
Application for SparkPost Email Dashboards - Looking for a good dashboard application for SparkPost? InetSoft's pioneering BI application produces great-looking cloud-based dashboards with an easy-to-use drag-and-drop design tool. Mash up your email and SMS delivery data with other enterprise sources for a comprehensive view of marketing program performance. View a demo and try interactive examples. All new clients and partners get free one-on-one business intelligence expert help to accelerate deployment...
BI Customers in the Education Field - Carnegie Mellon University Emory Law School Florida International University Georgia Tech Leeward Community College Mississippi College Northwest Nazarene University. A growing number of school districts use district-wide student information systems to monitor and compare student performance and the effectiveness of the educational process. These systems require a reporting solution capable of handling high user concurrency, large amounts of data, and data level security...
Collection of Sample BI Dashboards - Below are sample dashboards built with InetSoft's Java-based dashboard application, Style Intelligence. Explore further with the free 5-day self-evaluation. InetSoft's solution is true Software-as-a-Service for hosted and self-hosting, not a combination of client developer tools and a web-based delivery platform...

Dashboard Option for Amazon AWS - As an option, InetSoft offers a pre-configured AWS instance with data intelligence tools to give you a supercharged data transformation and data mashup platform for interactive dashboarding, visual analytics, and production reporting. Simply launch the instance and connect to your Amazon RDS, Redshift, MySQL, EMR and other data sources. Then, mashup and transform data on the fly, and build interactive, personalizable AWS dashboards, and visual analyses right inside a single web app...
Dashboard Server Monitor - Administrators are easily able to monitor their dashboard's server with InetSoft's dashboard software - a powerful and flexible business intelligence platform that has shaped the course of business at nearly a quarter of all Fortune 500 companies. View the example below to learn more about the Style Intelligence solution. The servlet status can be 'Running' or 'Stopped', and is displayed on the 'Server' > 'Status' page (in the Server tab)...
Dashboard Solution for Keen Event Streaming - Looking for a good dashboard solution for Keen event streaming? InetSoft's pioneering dashboard platform can mashup your streaming data with other enterprise sources. Make great-looking cloud-based dashboards with an easy-to-use drag-and-drop designer. View a demo and try interactive examples. If an organization is stitching together a bunch of best of breed systems along with an enterprise data management system, you probably don't want to do too much at once but I would say it's pressed...
Data Intelligence for Utilities - Utility companies face quite a few challenges today from maintaining infrastructure, combatting natural events, tackling a host of competitors sprung from deregulation, to being one of the main targets for cyber attacks. InetSoft's business intelligence tool can be a main weapon to win the battles. Nowadays more and more data is collected than can be easily analyzed with traditional analytical tools. Daily operational dashboards become outdated when they cannot be easily updated or connect to new data...

Enterprise-Grade Dashboard Software Solutions - InetSoft Technology offers users enterprise-grade dashboard software solutions in the form of its power BI suite, StyleBI. StyleBI is an operational business intelligence platform that features a powerful data mashup engine for the creation of dashboards, visual analyses, and reporting. StyleBI is a zero-client, Web-based BI tool that offers greater flexibility than that of its desktop-bound competition...
Evaluate a Dashboard Builder for Salesforce - Are you looking for a good dashboard builder for salesforce? InetSoft's pioneering dashboard reporting application produces great-looking web-based dashboards with an easy-to-use drag-and-drop designer. Get cloud-flexibility for your deployment. Minimize costs with a small-footprint solution. Maximize self-service for all types of users. No dedicated BI developer required. View a demo and try interactive examples...
Evaluated Many BI Tools - When ITS evaluated many BI tools along 20 different criteria, StyleBI was the only solution that exceeded all of their requirements. InetSoft's solution is now used to deliver BI to internal and external users, provide mash-ups combining data from multiple systems, automate report generation and delivery, deliver real-time information from existing and new data sources, and provide self-serve ad-hoc reporting. What ITS finds most convenient is that Style Intelligence provides the single location for all the reporting that they required...
Examples of Interactive Industry Dashboard - Are you curious as to how interactive web dashboards can help you explore your business data? Below are some examples of industry-specific interactive dashboards built with InetSoft's Style Scope. Click on any dashboard that interests you, and a live interactive version will open in a second tab of your web browser. You can ask questions of the data in these visualizations by moving sliders and other selection components, hovering your mouse over a given data point, or even viewing and extracting raw filtered data...

Good Monthly Dashboard Examples - As your business grows, so does your need for monthly dashboards that will automate business monitoring and management. Better sales numbers, more salespeople, more clients and accounts to manage also means more products to ship and track, more employee information to file, and more variables to react to. That's why InetSoft designed the easy to use dashboard software, StyleBI. In addition to web-based interactive dashboards, StyleBI also contains a powerful reporting engine that readily meets the needs of companies of any size...
How Do They Optimize That Data Access - Users do not need to know that can use SQL to access it. How do they optimize that data access and performance in order to improve data visualization and discovery? There a lot of interesting questions there we probably won't be able to get to all of today maybe. You may have heard this statement that everything that happens, happens somewhere right? So there is generally a location component to just about every single thing that we do. Whether it's purchases or the supply chain, it doesn't really matter. Something happens somewhere. So if you can incorporate the where component into your BI process, you're going find as that you're going to begin to derive all kinds of views and interesting types of information, things that you never anticipated you'd ever see...
How-to: Management of Dashboards - Click the 'New Viewsheet' button on the main toolbar. This opens the 'New Viewsheet' dialog box. In the 'New Viewsheet' dialog box, select the Worksheet (from 'Global' or 'User' scope) that will provide data to the Viewsheet. This Viewsheet will have access to all of the data tables defined in the underlying Worksheet. Note that you are not required to select a Worksheet. If you wish to associate the Viewsheet with a Worksheet at a later time, select the 'No Worksheet' option...
Impressive Department Dashboard Templates - Looking for department dashboard templates. Get inspired from these examples created with InetSoft's easy-to-use web-based dashboard application. All new customers get mentoring assistance for free to speed up their project delivery...

InetSoft's Monitoring Dashboard Interface - From the monitoring dashboard interface, users can fully customize data using InetSoft's dashboard software. View the example below to learn more about the StyleBI solution. The 'Monitoring' node under the Server tab also allows you to configure the following options. The 'Monitoring Level' menu on the 'Settings' page determines which of the other pages are available. A setting of at least 'Low' is required...
Information InetSoft's Graphical Dashboards - These pages pertain to InetSoft's graphical dashboard software. Filtering Dashboard Operators - InetSoft's award-winning dashboard software allows users to filter dashboard operators for a truly custom interactive reporting experience. The table below lists the operators available for use in filtering conditions. Operator description equal to True when the column value identically matches the specified criterion...
Looking to Compare Dashboard Options - Looking to compare dashboard options? Start by viewing demos for each one. InetSoft offers Web-based dashboard software that is easy to use and quick to deploy. Read customer reviews. See examples. Free Visualization Software - If you're looking for free visualization software to perform data mining or explore your data with an easy to use visual analysis tool, try Visualize Free. If you are looking for a way to visually explore and present data that standard office charting software cannot handle, and/or you're not able to install a desktop-based analytics application...
Named the Best Dashboard Creator for This Year - Dashboards are the eyes and ears of the business world. They see and hear everything and report it back to those in charge. Designing an effective dashboard has never been more crucial to a business than it is today. Gone are the days where a business is run on paper. Every day numbers change; employees make sales, customers return products, and inventory is shipped. Businesses move quickly and their technology needs to keep up...
One of the Best Internet-based Reporting Tools - Are you searching for an online reporting solution for your business? InetSoft Technology's StyleBI is a complete BI suite that offers reporting and dashboard capabilities in a zero-client web-based environment. Get: Pixel-perfect report design Interactive report viewing Flexible data mashup...
Researching Executive Management Dashboards - Researching management dashboard solutions for your organization's executive team? Deploy a small-footprint, easy-to-use web-based management dashboard application from InetSoft. As an innovator in reporting software since 1996, InetSoft has pioneered the evolution from static reporting towards interactive visualization of data via management dashboards. Managers get intuitive point and click access to performance data, and IT gets an easy to maintain management dashboard software solution...
Self-Service Project Management Dashboards - Visualization dashboards are the most intuitive ways to understand project information. However, not all dashboards are created equal. InetSoft's web app can easily connect to project management data to create self-service dashboards with rich built-in interactivity and customization. For successfully delivery of projects, project managers must utilize all project related data, for example, supply chain and issue tracking system data. These systems are normally scattered. Some third party data may even be in Excel files. InetSoft's data mashup makes data processing a light-weight, business user self-serviceable process with great efficiency...

Tool for Messaging Campaign Monitor Dashboarding - Looking for a good solution for Campaign Monitor dashboard reporting? InetSoft's pioneering BI application produces great-looking cloud-based dashboards with an easy-to-use drag-and-drop designer. Mash up your marketing campaign data with other enterprise sources for a unified view of marketing performance. View a demo and try interactive examples...
Tool for Monitoring Usage - So you know monitoring usage and effectiveness of data visualization components should obviously be baked into that whole process. Really pay attention to what value you're getting from things and be open to changing what you are doing. I've seen more and more companies using the data visualization tools as a real data discovery window in their operational data base. When you think about the other way people would try to analyze information – they would think of a potential problem..
Travel Agencies Use Dashboards - The corporate travel industry isn't one to adopt changes quickly, and that's understandable. There is no point in experimenting and risk making losses when everything is still in order and works perfectly. On the other hand, leisure travel is fast-moving and is adopting changes such as mobile payment, customer booking tools, etc. effectively drifting from traditional travel agencies' operations. Although the management of business travel is hesitant, the travelers themselves aren't...

Show Completed Dashboard Examples - Dashboards are essential data visualizations that allow users to explore and analyze their data intuitively in order to find business solutions. Easily completed dashboards benefit enterprises by enabling the fast recognition of strengths and weaknesses, as KPIs and metrics are updated to follow changing business conditions. A well completed dashboard visually conveys the same information that could only be gleaned by paging through many different reports...
Visual Dashboard Monitoring Software - Searching for visual dashboard monitoring software that's user driven and offers strong analytic and drill-down functions? InetSoft's dashboard software uses a visualization driven approach to enable rapid deployment of self-service business dashboards that are highly interactive. Since 1996 InetSoft has been offering business intelligence applications and dashboard tools that are flexible and powerful, serving over 5,000 enterprises and solution providers worldwide. StyleBI is InetSoft's flagship business intelligence platform that provides a dashboard, analysis and reporting solution that is...
Which Are the Best Performance Dashboards of This Year? - A performance dashboard is to a business what a windshield is to a driver: How would we know where we are, where we are going, and how to get there without one? At InetSoft, we understand that a good performance dashboard is the GPS for a healthy enterprise. Performance dashboards allow businesses to view key metrics. They give decision makers the power to efficiently view and execute strategies, processes, and objectives while also serving as a measurement for business activities...
Your Third Party Dashboard Software - Looking for good third party dashboard software? InetSoft, a pioneer in self-service oriented dashboard software integrates with almost any application. View a demo and try interactive examples. This is important for these kinds of specialized cloud systems to embed insights...