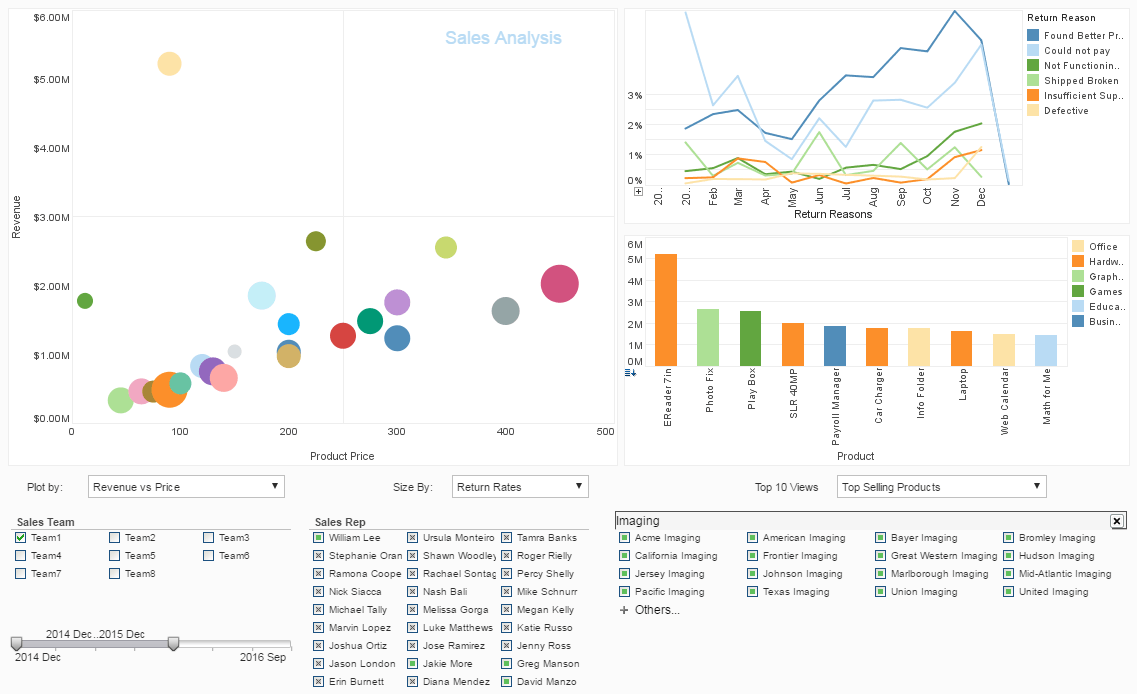
Small Footprint Executive Management Dashboard Software
Researching management dashboard solutions for your organization's executive team?
Deploy a small-footprint, easy-to-use web-based management dashboard application from InetSoft.
As an innovator in reporting software since 1996, InetSoft has pioneered the evolution from static reporting towards interactive visualization of data via management dashboards. Managers get intuitive point and click access to performance data, and IT gets an easy to maintain management dashboard software solution.
InetSoft's award-winning software has been deployed at thousands of organizations worldwide and integrated into dozens of other application providers' solutions serving vertical and horizontal markets of their own.

 |
View a 2-minute demonstration of InetSoft's easy, agile, and robust BI software. |
Alerts Are Useful for Executive Dashboards
An alert is a notification that a specified event has occurred, for example, that total sales have fallen below some critical level. You can set an alert based on highlight conditions in a report or Dashboard, or based on Dashboard Output component ranges.
To configure an alert for a report or Dashboard, follow the steps below:
1. Create a new scheduled task. See Create a Scheduler Task for instructions.
2. On the Conditions tab, set the frequency with which the alert conditions should be tested. (See Scheduler Conditions for more details on the available day and time conditions.) For example, if you want to test a report highlight condition every day, specify a 'Daily' condition.
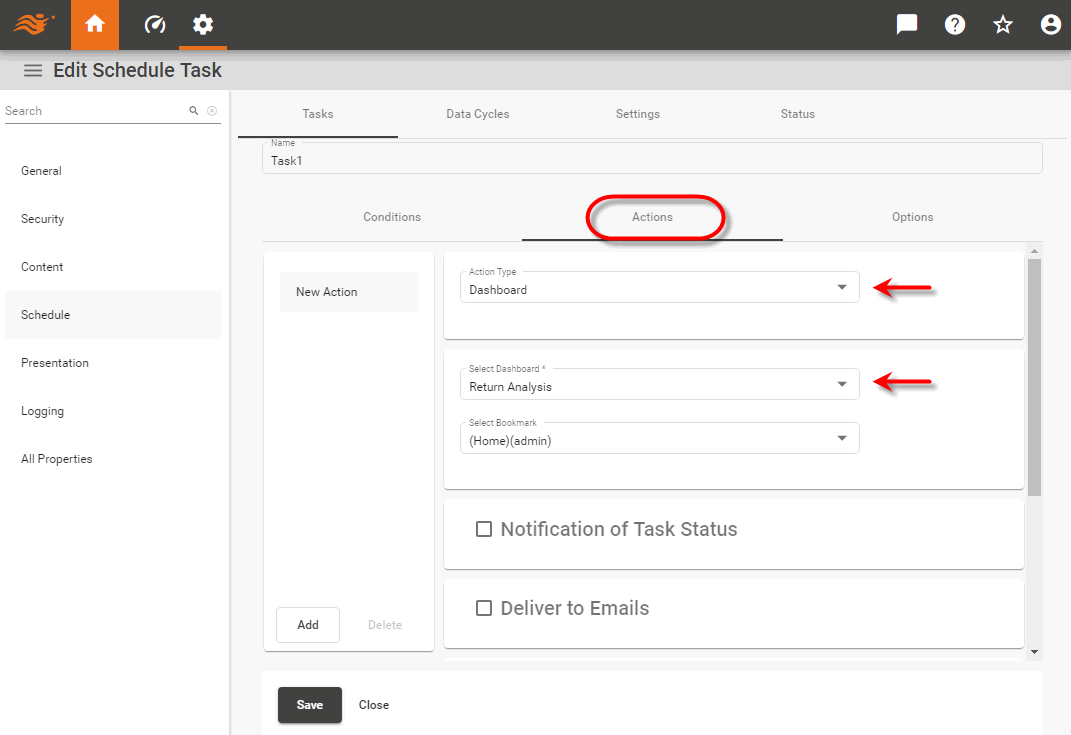
3. On the Actions tab, specify the report or Dashboard that contains the alert condition you want to test.

4. Select the actions that you want to perform if the alert is triggered. Generally, you will at least select the 'Deliver To Emails' option. (See Scheduler Actions for more about the available actions.) Enter a 'Subject' and 'Message' appropriate for the nature of the alert.
The table lists highlight conditions for all chart, table, image, and text components, as well as range conditions for Dashboard Output components.
5. In the 'Alert' panel at the bottom of the Actions tab, check the 'Execute action only under selected highlight conditions' option. This displays a list of the available highlight and range conditions for the selected Dashboard or report. Note: This panel is only available if the report or Dashboard contains highlights or ranges.

6. In the table, select the highlight or range conditions that you want to trigger the alert. When any of the selected conditions test true, the actions you specified above (e.g., emailing) will be performed.
7. Press 'Save' to save the scheduled task.
See Schedule a Dashboard in Visualize Your Data or View a Report for information on how an end-user can set an alert. See Automated Alerts for information about setting an alert based on conditions that are not defined in a highlight.
| #1 Ranking: Read how InetSoft was rated #1 for user adoption in G2's user survey-based index | Read More |
Articles About Executive Management Dashboards
42matters Dashboarding for Mobile Apps - Looking for a good solution for 42matters dashboard reporting? Mashup your mobile app data with other enterprise data for a wider view of performance. InetSoft's pioneering BI application produces great-looking cloud-based dashboards with an easy-to-use drag-and-drop designer. View a demo and try interactive examples. As you can see in the example here, dashboards are powerful tools for doing just that...
Advanced Dashboarding for Program Management - An executive dashboard allows you to gain more insight on your business, making it easier to highlight great aspects of your business, as well as any problem areas. Set custom key performance indicators (KPIs) to keep track of in your organization. Measure performance throughout your company and make improvements along the way. Save the hours of time spent on logging into multiple systems and running reports by simply using an executive dashboard, which shows you the latest results on each report you need...
Alternative SugarCRM Dashboard Solution - Are you looking for a good choice for a SugarCRM dashboard solution? InetSoft's pioneering dashboard reporting application produces great-looking web-based dashboards with an easy-to-use drag-and-drop designer. Get cloud-flexibility for your deployment. Minimize costs with a small-footprint solution. Maximize self-service for all types of users. No dedicated BI developer required. View a demo and try interactive examples...
Dashboard Solution for Present and Future - Scorecard dashboards bring together data for current execution and data defined for the future. Unlike historical data, future data can be dynamic as future expectation adjusts. InetSoft's web app can easily mashup many dynamic, ad hoc datasets. Once designed, InetSoft's scorecard dashboards have built-in inputs that can be dynamically changed on the fly...
Evaluate InetSoft's Executive Status Dashboard Report Tool - Looking for a good tool for executive status dashboard reports? InetSoft's pioneering dashboard reporting application produces great-looking web-based dashboards with an easy-to-use drag-and-drop designer. View a demo and try interactive examples. The key to creating an effective KPI dashboard is selecting the right tool, and InetSoft offers a simple and powerful way for users to create a KPI dashboard in order to meet the needs of any business...
Info about InetSoft's Executive Summary Dashboards - Looking for software for making an executive summary dashboard? InetSoft free and commercial dashboarding tools that help you quickly build and deploy attractive, interactive dashboards. Visit the Style Scope product page to learn more, see examples, view a demo, and read customer reviews. Below are articles, documentation, and resources related to InetSoft's dashboard software: Users of InetSoft's award-winning dashboard software can customize their reports fully by joining dashboard data in an interactive real-time data mashup...
Mashup Oracle Data with Others - Our efficient data source connectors allow for incremental updates and source optimized querying from Excel worksheets, SAP, Google Analytics, Salesforce, or a large variety of other applications. StyleBI offers Java Database Connectivity to relational databases, as well as custom connectivity to operational databases, data warehouses, and enterprise applications. For a full list of supported data sources, click here...
Other Side of Agile BI - The other side of agile BI is self-service BI. The Business Intelligence application, itself, is agile. The user can interact with it and change it, and even "muck around" in the data. These new Big Data capabilities can provide a great benefit to today's organizations. The larger the amount of data allowed for, the more questions can be answered definitively. InetSoft's drag and drop viewsheets and data worksheets enable dashboards to be modified and created easily, and even facilitate the joining of data sources without any SQL needing to be written...
 |
View live interactive examples in InetSoft's dashboard and visualization gallery. |
Pioneering Energy Management Dashboards - Are you looking for good energy management dashboard software? InetSoft's pioneering BI reporting application produces great-looking web-based dashboards with an easy-to-use drag-and-drop designer. Get cloud-flexibility for your deployment. Minimize costs with a small-footprint solution. Maximize self-service for all types of users. No dedicated BI developer required. View a demo and try interactive examples...
Replace Epicor Executive Dashboards - Looking for better Epicor executive dashboards? InetSoft, a pioneer in self-service oriented dashboard software allows for more personalization and supports data mashups across multiple sources for the broadest view of corporate performance. View a demo and try interactive examples. The best way to capture KPI's is through dashboard software. InetSoft's dashboards leverage KPI's by providing a dynamic, easy to understand visual display of an organizations most important metrics...
 |
Read how InetSoft saves money and resources with deployment flexibility. |
Searching For Good Management Dashboard Examples - Below are some good examples of management dashboards. A management dashboard can be looked at as an executive tool whose sole purpose it to make information easier to read. These dashboards can include a variety of different types of data, which can all be integrated into an easy to read dashboard. Good management dashboards allow users to seamlessly transition from one graph to another, without losing any important data...
Show Me Executive Dashboard Examples - Below are executive dashboard examples designed using InetSoft's drag and drop dashboard solution, some of which can be tested with the free downloadable evaluation copy of StyleBI, while others can be seen in the free visualization tool, Visualize Free...
Several Call Center Dashboard Examples - With just a few simple clicks users can drill down on this data in order to find out more comprehensive information than what is available at first glance. For example, maybe you see a red point on the heat map and want to find out more about it. Hovering over that data point will display more information about the call such as team, month, and success rate. From there, if you'd like to find out even more you can use the brushing tool in order to isolate all other data throughout the dashboard that has to do with that data point...
Simple Dashboard Design Example - The key to successful BI strategy is simple dashboard design. When a business or enterprise wants to explode the potential of their data findings they need to implement business intelligence in a way that is at once sophisticated and accessible. This is from where the idea of dashboard originated. And since their inception dashboards have become increasingly capable, but seemingly at the same time, overtly and unusably complex...
