Executive Program Management Dashboard
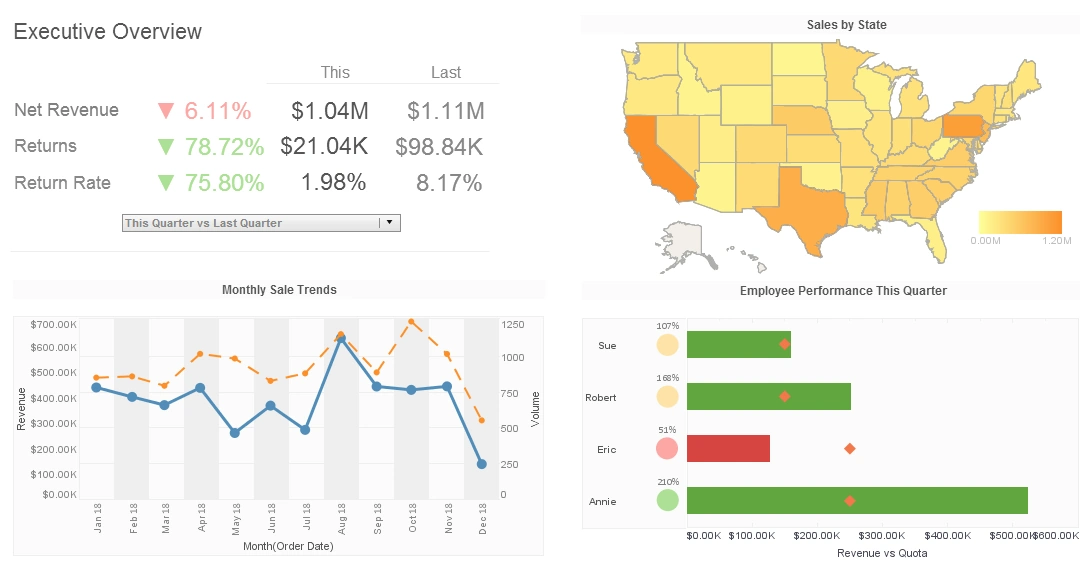
As an executive of a company, every work day is filled with a surplus of tasks. Finding time to track your company's performance can feel hectic; however, there is a reliable, quick and easy solution to this. An Executive Program Management Dashboard is a visual representation that allows executives to view their company's performance in real-time.
Executive dashboards make it possible to prioritize time, resources and work necessary for success. Dashboards provide a current view of defined processes, as well as existing issues and potential risks that can be prevented. Although an executive dashboard shows a detailed analysis on big data, creating a dashboard requires no IT skills and minimal learning.
Dashboards can combine loads of data from multiples sources by connecting with your application programming interfaces (APis), through your current business systems. All the data is pulled into one place, saving the hassle of having to log in to multiple systems and sources.
Automatically having data extracted prevents the risk of human error that comes with manually selecting and entering data. To make information more accessible, data can be manipulated.


Advanced Dashboarding and Analytics
An executive dashboard allows you to gain more insight on your business, making it easier to highlight great aspects of your business, as well as any problem areas. Set custom key performance indicators (KPIs) to keep track of in your organization. Measure performance throughout your company and make improvements along the way. Save the hours of time spent on logging into multiple systems and running reports by simply using an executive dashboard, which shows you the latest results on each report you need.
As an executive, it is extremely important to set up a powerful business plan for your organization to follow and successfully have your employees perform to these expectations. An executive dashboard can meet these needs by automatically showing your goals from your business plan versus your actual, real-time results. Becoming aware that their performance is being watched, employees will begin to improve their work; which will help your industry prosper.
Reliable and Convenient Dashboarding
With InetSoft, your data is safe under a secure system that has been trusted by many companies since 1996. Dashboards can only be accessed by the author and anyone given permission. Your dashboard automatically and securely connects to your data in real-time, and continuously updates in real-time. The dashboard is available for viewing on desktop, tablet, mobile device, and the cloud. An Executive Performance Management Dashboard allows you to better manage your business, increasing sales, profits and performance. Let InetSoft help you achieve this.

Who Uses Executive Program Management Dashboards?
Executive Program Management Dashboards are used by a wide range of organizations across different industries. These dashboards serve as a crucial tool for senior executives, program managers, and decision-makers to gain real-time insights and monitor key performance indicators (KPIs) related to various projects and programs. Here are some of the types of organizations and professionals who commonly use Executive Program Management Dashboards:
-
Large Corporations
- Large corporations in industries like finance, technology, manufacturing, healthcare, and more use executive program management dashboards to oversee complex projects and programs. These dashboards provide a holistic view of the status and performance of various initiatives.
-
Government Agencies
- Government organizations at various levels (federal, state, local) use program management dashboards to monitor and manage initiatives related to public services, infrastructure, healthcare, education, and other areas.
-
Non-Profit Organizations
- Non-profit organizations use program management dashboards to track the progress of initiatives related to social causes, humanitarian efforts, community development, and more.
-
Consulting Firms
- Consulting firms use executive program management dashboards to provide their clients with a clear view of project progress, resource allocation, and the achievement of strategic goals.
-
Healthcare Institutions
- Hospitals, healthcare networks, and medical research organizations use program management dashboards to monitor the progress of clinical trials, quality improvement initiatives, and other healthcare projects.
-
Information Technology (IT) Companies
- IT companies utilize program management dashboards to oversee software development projects, IT infrastructure upgrades, cybersecurity initiatives, and other technology-related programs.
-
Construction and Engineering Firms
- Construction and engineering companies use executive program management dashboards to track the progress of construction projects, manage resources, and ensure compliance with regulations.
-
Academic Institutions
- Universities, colleges, and educational institutions use program management dashboards to monitor academic programs, research projects, and institutional initiatives.
-
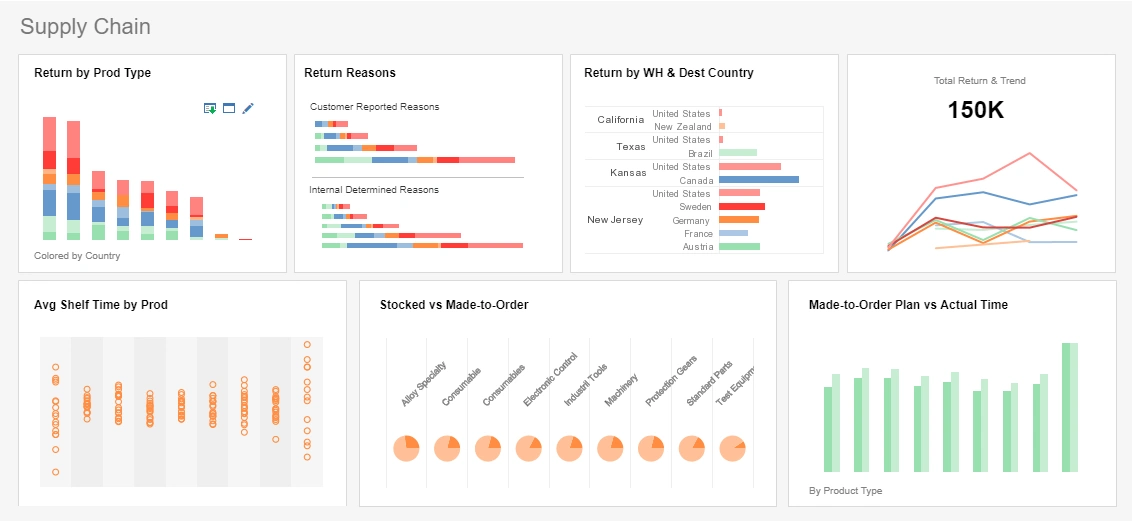
Manufacturing and Supply Chain Organizations
- Manufacturing companies use program management dashboards to manage product development, production schedules, inventory levels, and supply chain activities.
-
Financial Institutions
- Banks, investment firms, and financial institutions use executive program management dashboards to monitor initiatives related to risk management, compliance, mergers and acquisitions, and strategic investments.

More Articles About Executive Dashboards
Customer Service Operations Dashboard Using InetSoft's KPI Software - This is a powerful interactive dashboard for customer service managers and executives to monitor key performance indicators for a service operations department. In one view, you have seven information-packed charts and two embedded reports multiplied by the number of customer service representatives in your organization...
Demonstration of an Executive Reporting Dashboard Application - Are you looking for good executive reporting dashboard software? Since 1996 InetSoft has been making dashboard software that is easy to deploy and easy to use. Build self-service oriented dashboards and visual reports quickly. InetSoft's solution is true Software-as-a-Service for hosted and self-hosting, not a combination of client developer tools and a web-based delivery platform. All new clients and partners get free one-on-one business intelligence expert help to accelerate deployment. View a 2-minute demo and try online for free...
How To Proceed With The Data Governance Project? - Start with the need, pain or problem that needs solving. And we're working with a mortgage lender right now who just can't see the different relationships it has with the same individual. And that's a huge issue, not only for customer data integration but for data governance. The business impact is huge. This inability to actually recognize an individual customer results in things like duplicate mailings, redundant conversations and frankly, using silly sales pitches that have really embarrassed the company...
How These Stories Get Decomposed - Now the next thing we do from there is once we begin, and I'm going to show to you an example of how these stories get decomposed, but what we do next is we begin to decompose the stories or the questions into a set of business terms or a glossary or a data dictionary that then becomes where we move from the business value chain to the technical value chain to figure out where can I pull this data from...

Offering Better Epicor Executive Dashboards - Looking for better Epicor executive dashboards? InetSoft, a pioneer in self-service oriented dashboard software allows for more personalization and supports data mashups across multiple sources for the broadest view of corporate performance. View a demo and try interactive examples...
Put The BI Strategy Together - They understand that they need to develop the relationship with the business, to put the BI strategy together, to enhance the BI solutions deployed in the organization and the governance around it. But because they don't have an executive sponsor, they are not able to push those initiatives to the organizations, and they continue to operate with the ad hoc approach that most organizations take...

Tools in the Executive Reporting Suite - And show me the cost centers that make this number up right here? Well you can do that. With the tools in the executive reporting suite, you can create drilldowns. You can create breakouts, and for this report, select breakout, and then choose what fields you want to break this out by...
Visualizations for Hyperion - Web based mobile dashboards accessible from devices including iPhones, smartphones, Apple based & Android-based tablets Use standard web browsers e.g., Chrome, Internet Explorer, Firefox, Safari Unlimited multi-dimensional charting Drill down across views and into details Wide range of robust chart types including custom geographic mapping Visualization view re-use and collaboration...