Evaluate InetSoft's 42matters Dashboarding Tool
Are you looking for a good solution for 42matters dashboard reporting? Mashup your mobile app data with other enterprise data for a wider view of performance. InetSoft's pioneering BI application produces great-looking cloud-based dashboards with an easy-to-use drag-and-drop designer. View a demo and try interactive examples.
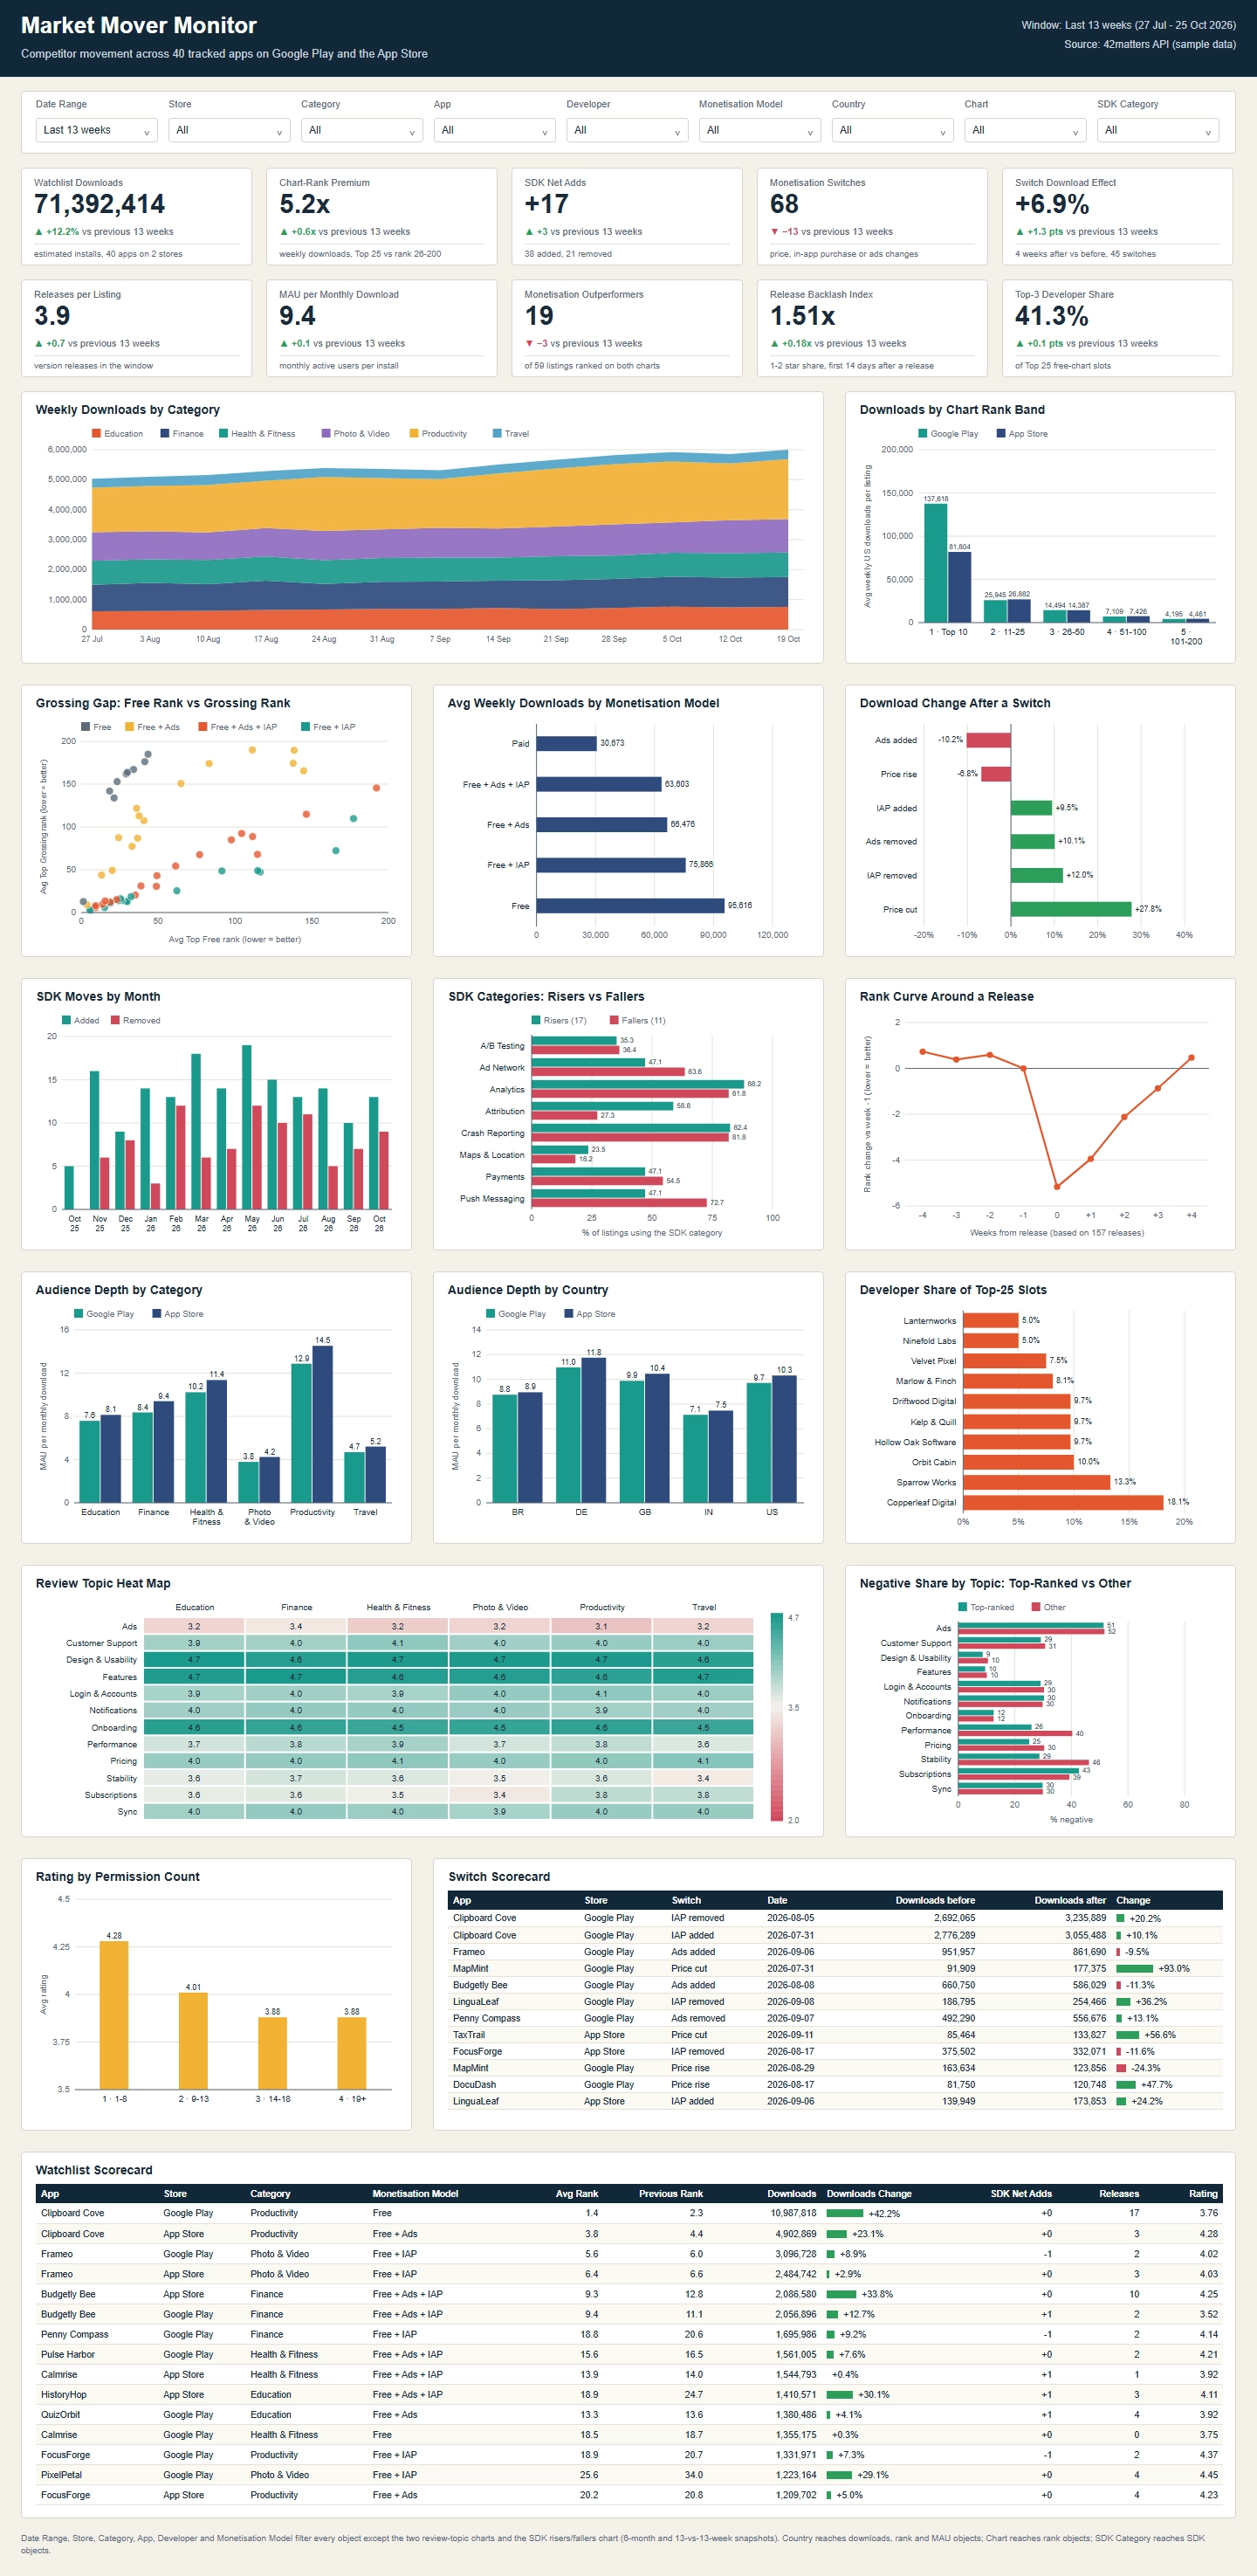
42Matters Market Mover Monitor Dashboard
The 42Matters Market Mover Monitor dashboard is a competitive intelligence dashboard designed for tracking changes across mobile apps in the Google Play Store and Apple App Store. Using app store metadata, SDK tracking, monetization signals, rankings, and download performance metrics, the dashboard provides a comprehensive view of market activity over time.
What Is the Market Mover Monitor?
Mobile app markets are constantly changing. Developers add new features, release updates, modify monetization strategies, integrate advertising SDKs, and compete for user attention. The Market Mover Monitor consolidates these signals into a single analytical dashboard that helps stakeholders identify emerging trends, monitor competitors, and understand the impact of strategic changes.
Dashboard filters allow users to analyze data by store, category, application, developer, monetization model, country, chart type, and SDK category. This flexibility enables both high-level market analysis and detailed competitive investigations.
Executive KPI Summary
The top section of the dashboard highlights key market indicators measured over a defined time period. These metrics provide a quick snapshot of app ecosystem activity.
- Watchlist downloads
- Chart rank premium
- SDK net additions
- Monetization switches
- Switch download effect
- Releases per listing
- Monthly active users per install
- Monetization outperformers
- Release backlog index
- Top developer concentration
These KPIs help users determine whether market conditions are becoming more competitive, whether monetization changes are increasing, and whether platform activity is accelerating.

Download Performance Analysis
Several visualizations focus on download activity across app categories and chart ranking tiers. Weekly category download trends reveal which sectors are gaining momentum, while download distribution by ranking position demonstrates the concentration of downloads among top-performing applications.
Analysts can quickly identify whether growth is broad-based across categories or concentrated within a small number of market leaders.
Monetization Intelligence
Monetization strategy is a primary focus of the dashboard. Applications can be segmented based on business model, including free, paid, subscription-supported, advertising-supported, and in-app purchase implementations.
Dedicated charts evaluate:
- Average weekly downloads by monetization model
- Monetization outperformers
- Download changes following monetization switches
- Relationships between ranking performance and revenue strategies
These insights help organizations understand which monetization approaches correlate with stronger market performance within specific categories and regions.
SDK Activity Monitoring
One of the dashboard's distinguishing capabilities is visibility into SDK integration behavior. SDK additions and removals often signal strategic priorities such as advertising, analytics, attribution, crash reporting, testing, maps, communications, and payment processing enhancements.
SDK analytics include:
- Monthly SDK additions and removals
- SDK category risers and fallers
- Net SDK additions
- Category-level adoption trends
Competitive intelligence teams can use these metrics to identify emerging technologies and monitor infrastructure investments across the market.
Release and Ranking Analysis
The dashboard measures the effects of release activity on app rankings. By examining ranking curves before and after releases, stakeholders can assess whether updates are helping or hurting app visibility.
Supporting metrics such as releases per listing and release backlog indexes help reveal development cadence and product maintenance effectiveness.
Product teams can benchmark their release velocity against competitors while identifying best practices among top-performing applications.
Audience Depth and Market Penetration
Audience depth metrics compare monthly active users relative to downloads across app categories and countries. These measurements help distinguish between applications that generate high download volumes and those that retain active audiences.
Country-level analysis provides valuable insight into regional engagement patterns, enabling app publishers to identify markets with strong retention and monetization potential.
Developer Market Share Analysis
Developer concentration charts illustrate which publishers dominate top-ranked app positions. By monitoring share of top slots, organizations can evaluate market structure and assess competitive barriers within categories.
This information is particularly useful for investors, app publishers, corporate strategy teams, and market researchers seeking to understand ecosystem leadership.
User Review Intelligence
Customer feedback analysis is presented through review-topic heat maps and negative-share comparisons. Topics such as onboarding, performance, stability, pricing, notifications, subscriptions, and support are monitored across app categories.
By identifying recurring user concerns, organizations can prioritize product improvements and benchmark customer satisfaction against competitors.

Competitive Scorecards
Detailed scorecards provide application-level benchmarking data. These records combine ranking metrics, download performance, monetization approaches, SDK changes, release activity, ratings, and market movements in a single view.
Analysts can use scorecards to investigate individual market movers, understand the drivers behind growth, and compare performance across competing apps.
Key Benefits
- Monitor competitive movements across app stores.
- Track monetization strategy effectiveness.
- Identify emerging SDK adoption trends.
- Measure release impact on rankings.
- Benchmark download performance by category.
- Evaluate developer market concentration.
- Analyze audience engagement across regions.
- Detect customer experience weaknesses using review analytics.
- Support product, marketing, and investment decisions.
A Comprehensive View of the Mobile Application Ecosystem
The 42Matters Market Mover Monitor dashboard delivers a comprehensive view of the mobile application ecosystem by combining download intelligence, monetization analytics, SDK tracking, ranking performance, release activity, audience insights, and review analysis. The result is a powerful decision-support platform that enables organizations to identify market opportunities, monitor competitors, and make data-driven strategic decisions.

More Resources and Articles about InetSoft's 42matters Dashboarding Tool
Best Performance Dashboard Example - A performance dashboard is to a business what a windshield is to a driver: How would we know where we are, where we are going, and how to get there without one? At InetSoft, we understand that a good performance dashboard is the GPS for a healthy enterprise...
Content Collaboration Dashboard Tool for Box - Looking for a good solution for Box reporting? InetSoft's pioneering BI application produces great-looking dashboards that mashup content collaboration data with other enterprise data in your organization. View a demo and try interactive examples...
Data Dashboard Design Ideas - Searching for the best dashboard designs? InetSoft provides many examples to learn from, demonstrating consistency across chart elements and pleasing color palettes...
Define Dashboard Aggregation - InetSoft's award-winning dashboard software allows users to combine data from disparate and seemingly incompatible sources with sophisticated aggregation options. View the example below to learn more about the StyleBI solution...
Examples of Business Dashboards - Below are examples of business dashboards built with InetSoft's business dashboard software, some of which you can try out with the free downloadable 5-day evaluation copy of Style Intelligence...

Executive Program Management Dashboard Solution - An Executive Program Management Dashboard is a visual representation that allows executives to view their company's performance in real-time. Executive dashboards make it possible to prioritize time, resources and work necessary for success...
Great Sales Performance Dashboard Example - As you can see in the example here, dashboards are powerful tools for doing just that. The sample dashboard provided tracks many sales-related key performance indicators in a highly visual and digestible manner...
How-To: Creating a Dashboard - The Visual Composer is a web-based tool for creating Data Worksheets, Viewsheets, and other assets. You will use the Visual Composer to link graphical components of a Viewsheet to the data assets constructed within a Worksheet. For example, you will link a Range Slider to a date field, or link a gauge to the aggregate of a numeric column...
InetSoft's Solution for Procurement Dashboards - When trying to monitor key performance measures for procurement, such as the percentage of non-contract purchases to total purchases, you need the right BI tools to properly value your future acquisitions. A robust BI solution is one that can analyze and collate massive amounts of data, providing actionable insights for a competitive price. And in order for your organization to get the full benefit from your data, all departments need to be able to access and explore data relationships, enabling better business decision-making...
Learn About Analytical and Operations Dashboards - There are two main varieties of dashboards: analytical dashboards and operational dashboards. Analytics dashboards are just that, analytical. They are created for the sole purpose of gaining knowledge and insight from data. Users of these dashboards seek insight into the past and the future, wondering what happened and what's to come...
Real Time Business Activity Monitoring - InetSoft's visualization dashboards can be easily made to auto-refresh with real-time data. This BAM call center status dashboard updates in real time so managers can see how the overall calling queue compares to its set threshold. Moreover, each agent's call progress can be seen at a glance. Where attention may be needed, a big red face will indicate this to the manager...
Searching for Education Dashboard Software - Searching for education dashboard software with automated data monitoring and report generating functionality to use with existing systems? InetSoft's dashboard software is easy to deploy and use and offers a highly interactive and customizable design...
Self-Service Reporting Reasons - The reasons for heading towards self-service reporting are almost self-evident. There are constant budget pressures, yet competitive pressures call for increased access to relevant information. IT can be caught in the middle. The pragmatic decision is to shed some of the centralized reporting function housed in IT and enable self-service reporting by business users...

Several Tracking Dashboard Examples - Are you using tracking dashboards in your business? If not, then presenting business data to your employees and upper management staff is taking valuable time away from other areas of your business that desperate need of attention...
Show Good Information Dashboard Examples - Below are some good examples of Information Dashboards. An information dashboard is management tool that allows information, whether it be numerical or text, to be represented in a visual dashboard. Good information dashboards can combine this data into easy to read graphical representations of the business they are analyzing...
Social Media Dashboard Software for Buffer - Social media reporting software is crucial for analyzing the results of your various organic channels. Buffer is a software application designed to manage accounts in social networks, scheduling posts as well as analyzing their results...
Talking About Different Performance Management Software Packages - There are over 100 different performance tracking software packages. So avoid this trap. Just because balanced scorecard is in the title doesn't mean you are going to have a balanced scorecard, does it? A piece of software is not going to give you a balanced scorecard. Avoid this one, too. Just give it to the planning shop. It's their job. Let them do it. Let them show us what they can build on their own, wrong answer...
Tracking Business Intelligence Metrics - Searching for a way to track business intelligence metrics? InetSoft offers an easier to use, easier to deploy BI platform that is also more cost-effective. Read about using InetSoft's BI software...
Tracking Key Finance Metrics - Researching finance dashboards for tracking key metrics? Since 1996 InetSoft has been making dashboard software that is easy to deploy and easy to use. Its unique data mashup capabilities enable unified views of corporate performance and maximum self-service...
Trending Information Based on a Map - I think you see so much movement around people kind of trying to incorporate geospatial analysis to their data, where they can actually sort of look at and identify trending information based on a map. Just being able to overlay different context on that trending information tends to really drive a much more rapid level...
Turnkey Cloud-based Dashboard Solution - Those who are searching for a faster path to tracking their business performance or lack the IT resources to deploy an advanced data exploration solution should consider InetSoft's agile turnkey cloud-based business dashboard solution...

Upgrade Your Dashboards and Reports for JDE - Whether you are using JD Edwards World or EnterpriseOne applications, you can benefit from a greater level of interactivity or from a more contemporary look and feel versus what is possible with JDE's own dashboards and reports. InetSoft has been a leader in the development of highly engaging, user-friendly HTML5-based visualizations and dashboards that are easy to develop and personalize...
UI Design Dashboard Tips - Now more than ever, there is more emphasis on the importance of UX in dashboards. This has, therefore, led to a rise in the variety and number of dashboard UI tools. All customer experience strategies have these tools as an essential piece...
Using Data Mashups in the Enterprise - Learning about data mashup applications? InetSoft is a pioneer in data mashups, and its BI software makes mashups from disparate data sources possible with a drag and drop mashup tool. Read articles below for more information, or view the enterprise data mashup solutions page...
Various Departmental Business Intelligence Examples - Looking for departmental business intelligence examples? InetSoft's industry pioneering BI platform can support any department's dashboard needs. Interact with examples in the library, read articles about its capabilities below, and Request a Demo...