Departmental Business Intelligence Examples
Are you looking for departmental business intelligence examples? InetSoft's industry pioneering BI platform can support any department's dashboard needs. Interact with examples in the library, read articles about its capabilities below, and Request a Demo.
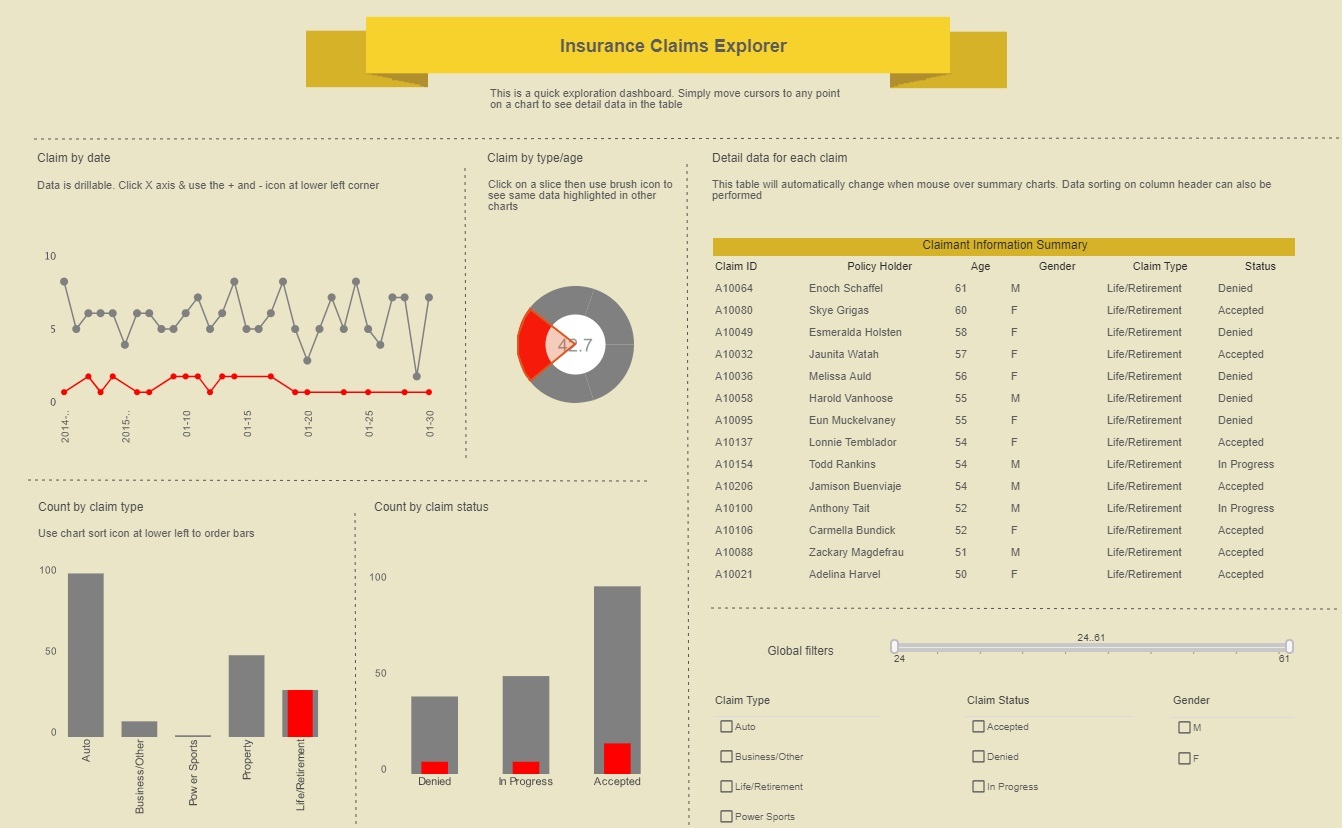
Insurance Claims Dashboard - The Insurance Claims Dashboard example here demonstrates InetSoft's user-friendly analytical dashboards, perfect for organizations in need of a customizable and interactive software to assist in everyday operations. The particular chart below portrays some of the many tools that InetSoft carries in addition to featuring a multi-dimensional view on the data. InetSoft's solution provides users with a large collection of visualizations and charts to create dashboards that meet their criteria or are easy to analyze. Simplifying the process even further, the point and click environment allows users to easily drill down into their data sets by claim type, claim status, gender, and age for a detailed analysis. With InetSoft's intuitive software, users can quickly build and analyze productive visualizations that sort, filter, and monitor the status of insurance claims and other relevant information while helping them keep track of and achieve long term goals and objectives. Monitor, explore, and analyze by filtering and sorting desired information. Easy to use, modify, and create charts and visuals. Leverage user-driven data mashup. Upload and sift through multi-dimensional data to spot trends and aberrations. Slice and dice data with simple point-and-click method. Share visual analysis with others...
Facilities Management Dashboards - InetSoft, an innovator in BI software since 1996, and AssetPoint, a leading provider of (EAM) Enterprise Asset Management and (CMMS) Computerized Maintenance Management Software solutions for over 30 years, have partnered to offer easy to use, interactive maintenance dashboard solution for tracking and managing predictive and preventive maintenance. AssetPoint's flagship product TabWare is an easy-to-use solution for managing all processes of maintaining manufacturing or industrial equipment and the operational facilities of any organization. KPI for Maintenance Dashboards: Integrated into the application is a pre-built KPI dashboard that monitors eleven key metrics: Equipment downtime. Maintenance backlog. Percentage of planned work for prior month. Maintenance cost as a percentage of equipment replacement value. Percentage of Preventive Maintenance (PM) and Predictive Maintenance (PdM) worked in the prior month. Percentage of PM and PdM overdue in the past month. Estimating accuracy. Maintenance, Repair and Operations (MRO) inventory turns. MRO inventory as a percentage of equipment replacement value. Total value of outstanding purchase orders. Total value of receipts that have not been invoiced...
Financial Reporting Solution - Finance departments are challenged everyday with more reporting demands by executives, boards and external agencies. This diverse audience also increasingly wants more transparent and quicker responses. On the other hand, CFOs want more analysis to discover opportunities and insights. Visualization dashboards with rich interactive functions empower finance professionals with unprecedented self-service information and exploration. This, in turn, minimizes follow-up explanation otherwise needed by information consumers. Machine learning uses accumulated data for forecasting, the discovery of irregularities, and for auditing. It not only saves finance professionals precious time but also delivers findings that are hidden in data. InetSoft's data intelligence software further provides pixel-perfect document reports. Document reports are especially suitable for dual online and offline use. When used online, a document report is live with interactive functions such as streaming, searching and page jumping. The paginated nature of document reports allows large amounts of formatted information be delivered to customers or external entities easily...

How BI Systems Relate to Finance - We're switching gears now. That was our background on business intelligence. Now we're going to talk about BI systems and how they relate to finance. It's my attempt to depict what I think people in finance departments do as their finance system or the BI systems that they tend to interact with on a daily or weekly basis starting with operational systems. Those are the systems that run the business on a day to day basis, be it general ledger, your accounts payable, accounts receivable, sales, invoicing, things like that. Operational reporting is a confusing term. It means different things to different people and can be actually implemented in many different ways. But at a high level it's about running reports off of individual operating system. We have business intelligence which is all about generating reports off of a data warehouse or a data mart. It's obviously a little more than that, but that captures its essence in terms of the strategies and benefits of BI. And then there are other systems: the planning, the budgeting, the forecasting and the consolidation systems that Finance uses. Now, if I could draw a circle around the planning and budgeting square and the business intelligence square, I can't do that on this Web conference system, but if I could, and pull those two systems together, you get something that vendors today are touting as performance management. And performance management is now making a big difference, perhaps even bigger than BI...
Law Firm KPI Dashboard - Looking for a tool for a good lawyer dashboard application? InetSoft is a pioneer in self-service dashboarding and offers a solution perfect for lawyers. View a demo and try interactive examples...
Legal Department Dashboard - Could your law firm use an easy, flexible dashboard reporting system to track performance of its attorneys' productivity? Find the hidden trends, compare milestone performance, and identify top performers. Leading KPIs to track include number of matters opened, hours worked, number of average days billing in lockup, average fee per matter, and ratio of average billed to average worked rate. Staying on top of KPIs can help identify issues ahead of time before they show up in the lagging key metrics such as fees billed in a month, hours billed, cash receipts, and revenue per lawyer. InetSoft's lightweight software for legal firms provides easy-to-use dashboard reporting design tools to create interactive monitoring and analytical dashboards that a non-technical partner can use to manage his or her team. Another key area for law firms to manage proactively is the performance of their existing client base. Key performance indicators in this area include client retention rate, which is the is the ratio of number of clients billed in the last 12 months to the same clients that had been billed in the 12 months before that. Another is the dormant client percentage rate, which is the ratio of the number of clients that the firm has not handled a matter for in two of the past three years to the number of total clients. A related area to focus on is attorney productivity. Metrics include billable hours per full-time equivalent timekeeper, which is is calculated by taking the gross number of billable hours worked by paralegals, associates and partners and dividing by the number of full-time equivalents in each category. Another is the ratio of average billed to average standard rate, which is the ratio of the average billed hourly rate for a timekeeping category, which is calculated by dividing fees actually billed by the hours billed to the average standard hourly rate for the category of timekeeper...
Logistics Industry Uses Analytic Dashboards - The logistics industry has a treasure trove of data collected from various sources that prove invaluable when used to its fullest potential. Logistics companies can optimize their data collection by using online reporting and dashboard software . These systems can appropriately harness this large amount of big data into using productively to make business operations efficient. Business dashboards and analytical software enable organizations involved in supply chains to gain insightful data with just a few clicks. What are some of the practical uses of analytics and business dashboards in this industry? Here are some of the key applications of this technology in the logistics industry...
Maintenance Department Reporting Tool - Looking for a good maintenance reporting tool? InetSoft's pioneering reporting application creates great dashboards and reports for facilities maintenance with an easy-to-use drag-and-drop designer. View a demo and try interactive examples...
Maritime Port Traffic and Weather Dashboards - The Maritime Port Traffic and Weather Dashboard presents a comprehensive operational view of vessel activity, cargo movement, berth utilization, and environmental conditions within a single, unified interface. The dashboard integrates operational throughput data with live weather intelligence, reflecting the reality that port performance is deeply influenced by environmental conditions. The sections below break down traffic patterns, berth efficiency, cargo performance, vessel mix, and geographic origins to support both operational control and strategic planning. Across the top row, the dashboard highlights essential performance indicators. These include Vessel Arrivals, Vessel Departures, Average Berth Utilization, Cargo Volume, and Current Weather conditions. Presenting these indicators first establishes immediate situational awareness. For example, Vessel Arrivals and Vessel Departures offer insight into traffic balance. A sustained gap between arrivals and departures may indicate congestion risk or berthing inefficiencies...
Market Research Department Analytics - Below is a live example of an interactive web-based market research and analysis dashboard built using InetSoft's Style Intelligence. Organizations can build dashboards that allow all end-users to track and analyze their market research. It is a valuable and easy to use application that can aid organizations in turning their market data into actionable information to optimize performance. Tracking and presenting research findings with an application like this is more valuable and easier to use than tools such as Excel and PowerPoint. Charts like this one can display answers to a particular question, or multiple questions at once. InetSoft's software is driven by the user and is easily customized to meet specific needs or inquiries at any time within its drag-and-drop design...

Marketers Usage of Dashboards - Many marketing specialists use dashboards as they help visualize data for easier comprehension and usage. First of all, it's necessary to define a marketing dashboard. This reporting instrument provides key performance indicators (KPIs) and other metrics in the shape of charts, graphs, and other visual elements. These tools make it possible to evaluate marketing performance objectively. The main question to answer with a marketing dashboard is, "Where are we?" It is possible to correct tasks, set up new goals, and change the schedule using this tool...
Marketing Dashboard Software - Marketing dashboard software is crucial for analyzing a marketing department's leads, progress, and traffic. Software is particularly useful to marketing professionals when it comes to measuring the effectiveness of digital marketing campaigns, tracking the performance of blog posts, external website links, and search engine rankings. InetSoft's marketing dashboard software allows marketers to create web-based interactive dashboards that can take the viewer from a high-level view of marketing performance down into the details for further investigation. Advanced visualization allows for further analysis and multidimensional exploration of data. With instant connectivity to Google Analytics, Google AdWords, salesforce.com, and a host of other marketing oriented data sources, InetSoft's dashboarding software makes it easy to measure KPI's such as total cost per lead, incremental sales, website bounce rates, average lead scores, and more. With a versatile and customizable dashboarding software, analyzing the engagement of website visitors and potential leads has never been easier...

Marketing Report Software - InetSoft's marketing report software is easy to use, customize, and adjust to the end user's personal preferences. The application can be up and running in weeks, not months. The reporting software makes it easy for marketing professionals to analyze various data in dashboards, visualizing metrics such as engagement on social media, and the success or lack thereof of pay-per-click advertisements. With InetSoft's drag-and-drop interface and point-and-click controls, marketing users who lack a technical background can build interactive marketing reports, all without help from IT. In addition to this, InetSoft's report software provides the opportunity to mash up marketing data from a variety of sources to provide a unified view of corporate progress. Data mashup is useful for creating various marketing KPI's, because it makes merging data from various data sources easy and effortless. Through mashup capability, users are able to drag and drop acquisition data from Google Analytics and mash it up with opportunity data from salesforce.com or any common CRM. Since InetSoft's marketing report software ensures web based accessibility, these mashup driven reports reports can be shared and distributed across the company, allowing all team members to be on the same page...
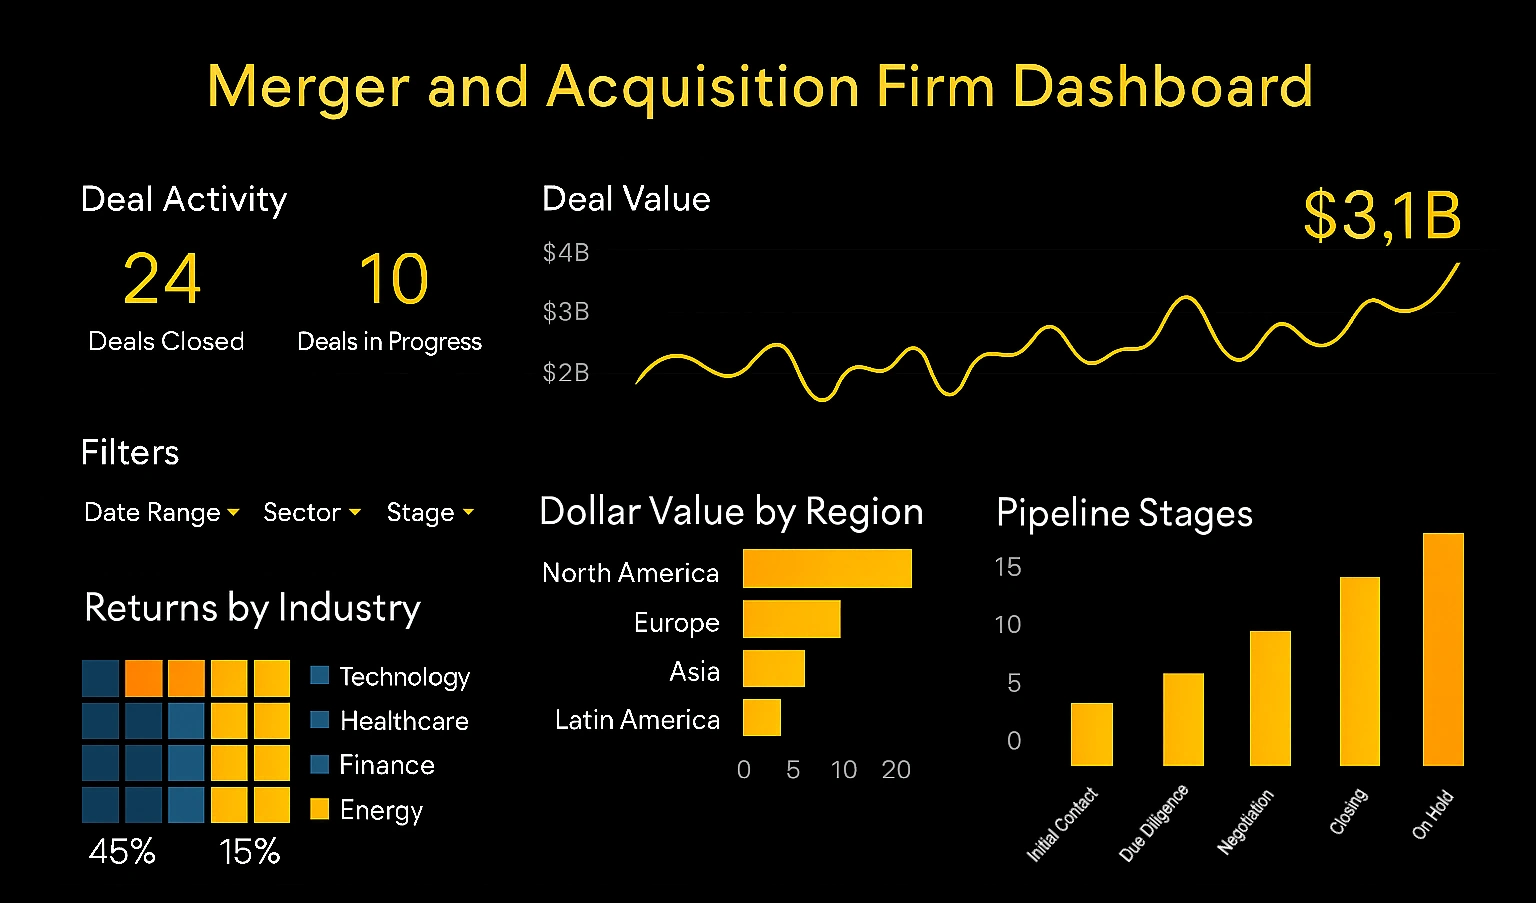
Merger and Acquisition Dashboards: KPIs and Advanced Analytics - Merger and acquisition activity is inherently complex, high stakes, and time sensitive. A well designed M&A dashboard does far more than summarize numbers. It becomes a strategic command center that helps partners, deal teams, analysts, and operating executives understand pipeline health, risk exposure, valuation trends, and post-close performance in real time. When built correctly, it transforms fragmented deal data into actionable intelligence. An effective M&A dashboard reflects the full lifecycle of a transaction: origination, qualification, diligence, negotiation, closing, and post-merger integration. Each stage generates its own set of key performance indicators, and each KPI serves a different strategic purpose. Together, they provide visibility into growth velocity, execution quality, and value creation...
Medical Clinic Dashboards - Modern medical clinics generate enormous volumes of data across scheduling, billing, clinical documentation, patient engagement, and quality reporting systems. Yet many clinics still struggle to turn that data into timely insight. One multi-specialty outpatient clinic recently faced this challenge head-on by adopting InetSoft’s dashboard and analytics platform to unify and analyze information from multiple practice management and electronic health record (EHR) systems, including athenahealth, DrChrono, NextGen, Tebra, and Cliniko. The result was a dramatic improvement in reporting speed, operational visibility, and strategic decision-making. Like many growing clinics, this organization had adopted different systems over time to support distinct needs. Some departments relied on athenahealth for clinical documentation and claims submission. Specialty providers preferred DrChrono for mobile charting. A legacy group used NextGen for historical records and billing workflows. Marketing and patient engagement data flowed through Tebra, while allied health teams tracked scheduling and treatment outcomes in Cliniko...
Mining Industry Dashboard Benefits - If you don't already work actively in the mining industry or on a mine, you might not understand the benefits of a mining industry's dashboard. There are a lot of challenges that the operators and mining process engineers face that need adequate solutions. However, to proffer the adequate solution, there has to be a quantitative and in-depth knowledge of the relevant parameters and processes surrounding those challenges. This is where the importance of the dashboard within the mining industry starts to show itself. With the dashboard, operators can quickly get all the information that they need to understand the problem at hand and provide a long-lasting solution to it. The fact that dashboards are data-driven and produce real-time and reliable estimates of the variables surrounding a process correlated with other systems and are used as vital tools in solving problems make them something of a necessity for the mining industry. Just in case you still are not convinced about the benefits of the dashboard for the mining industry, this article from authors at essay writing service reviews highlights some of the significant benefits of the dashboard for this industry...
Mining Industry Dashboard Usage - These dashboards are a must for managers and field operators as it is able to provide them with up to date information regarding key metrics and performance indicators. Supervisors are therefore able to use these dashboards to their advantage and keep track of things in real-time, such as: Use them for key decision-making procedures and keeping the production in line with their work policies and ethics. Dealing with environmental pollution effectively while ensuring that all machines, apparatus, and mining tools work accordingly without malfunctions. Making sure that working conditions are kept at a level where workers and their wellbeing is safeguarded at all times. Collect valuable data and information to strategies and formulate both long-term and short-term goals and objectives along with detailed reports...
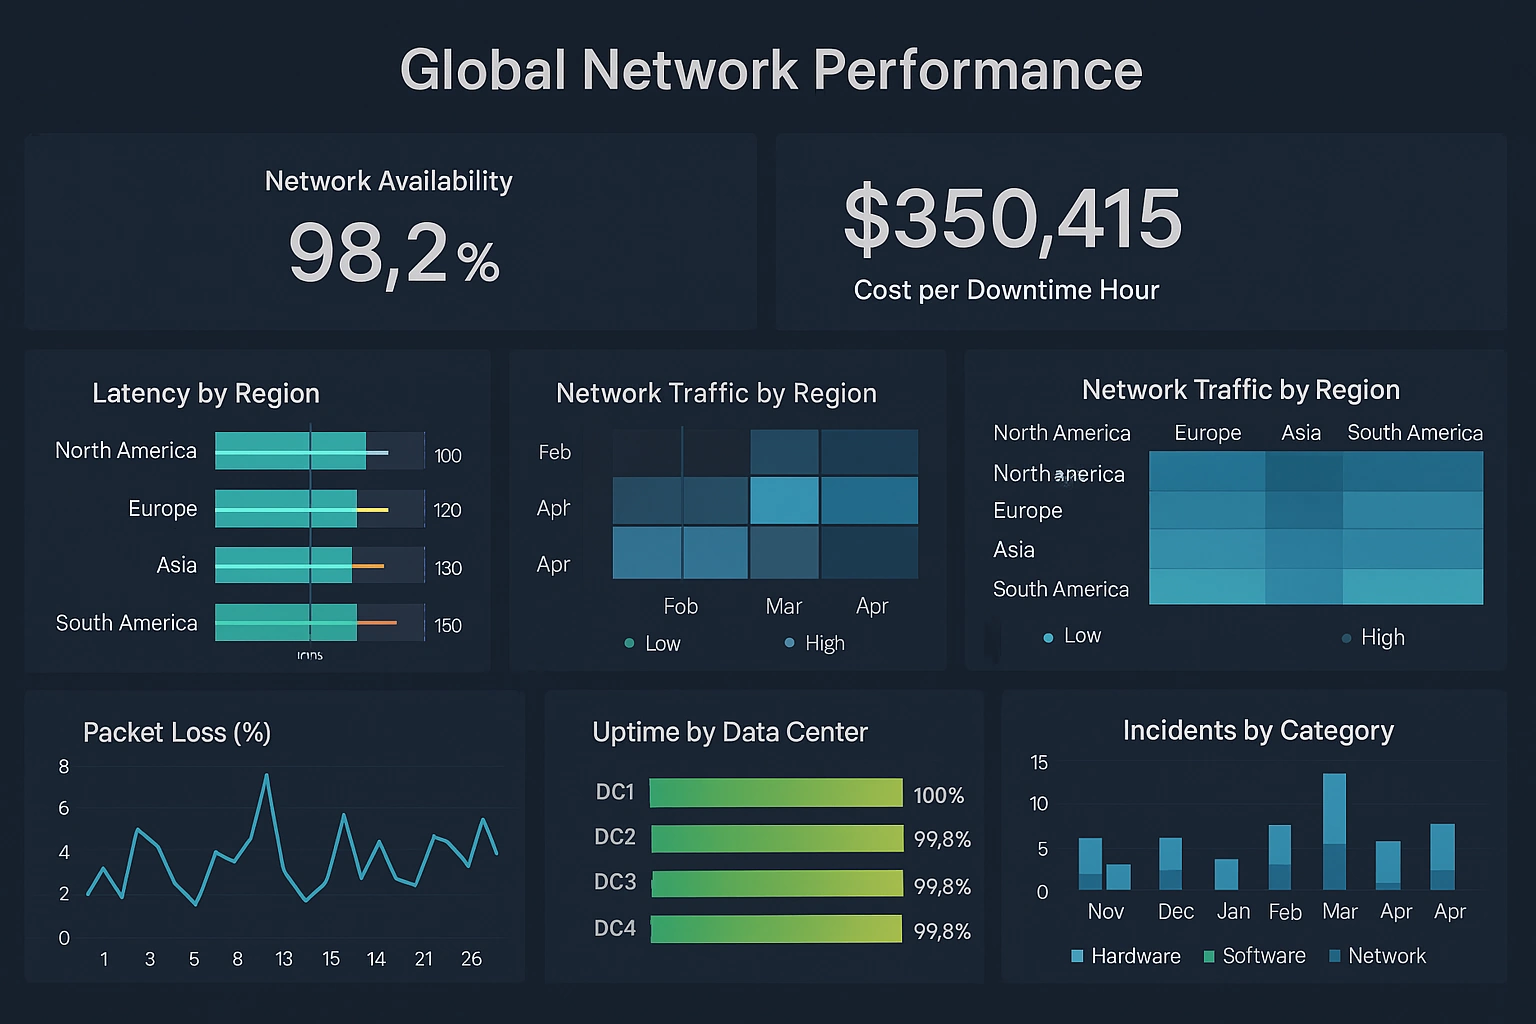
Network Operations Managers Use Dashboards - Dashboards are very essential for companies that deal with online customer services and sales departments. The prime need of having a dashboard in your organization is that it will help you track and visualize the overall performance. Once you know the elements that are affecting your business performance, you can modify your objectives and change your approach to market trends and customer behavior. Let's say that you own a business that is connected with multiple networks. Dealing with such a system can be tedious and challenging. You know certain challenges will be there, and you need to act professionally towards them. The toughest task is to manage those networks with the utmost accuracy. If your network is not performing well, you have to face criticism for being outdated with the customers' data. One way to counter this problem is to hire a team to look after your networks, and another one is to have a NOC (Network Operation Center) at the company. In this article, we have provided detailed information about managing the dashboard for business purposes. Apart from this, we have also illustrated the key benefits of NOC dashboards. So, without further ado, let's dive straight into it...
Performance Management Department Examples - A performance dashboard is a business management tool that will allow a business to keep track of all aspects of their daily activity. Below are examples of performance dashboards built with InetSoft's easy-to-use dashboard software. For example, the sales performance dashboard is able to track your sales on the east coast and compare them with your sales on the west coast. When one of those sales unexpectedly rises or falls, you are able to investigate the reasons behind this and make the necessary changes to keep your business profitable. By converting your businesses numerical data into graphical/visual representations, performance dashboards allow the users to gain better insight to the more intricate parts of their business that they previously did not understand. Performance dashboards should allow businesses to do the following: Monitor critical business processes and activities using metrics of business performance that trigger alerts when potential problems arise and when goals are met. Analyze the root cause of problems by exploring relevant and timely information from multiple perspectives and at various levels of detail. Manage people and processes to improve decisions, optimize performance and steer the organization in the right direction...
Personnel Management Dashboard - Explore an example in InetSoft's dashboard template gallery...
Performance Management Department Tool - Since 1996, InetSoft has provided performance management tools that are Easy, Agile, and Robust - complete with interactive and monitoring dashboards, scorecards, and drill-down business reporting. Evaluate InetSoft's StyleBI for an affordably priced, quick to deploy, and easy to use performance management process. Monitoring dashboards do not need to be static charts. InetSoft's business dashboard software uses a visualization-driven approach to enable rapid deployment of self service business dashboards that are highly interactive. This performance management system is business user-driven and offers strong analytic and drill-down functions. The key advantages are: Monitor, explore, and analyze and drill down into details Easy to use, modify, and create by business users Leverage user-driven data mashup for maximum self service Suitable for executive dashboards and power-user exploration Combine multiple interactive reports and charts in one screen to replace scores of static ones. Dashboards empower business users with an intuitive monitoring and analytic environment resulting in enhanced business performance management, using the information stored within their performance management system. Within an executive dashboard, statistics and data for the company as a whole can be closely monitored by the people who need to know and can take action...
Product Management Department Dashboard - Are you an app developer looking for dashboard software solutions to monitor your portfolio performance? InetSoft offers a easy-to-use performance monitoring tools that can be deployed in days not months. Like all service providers, mobile app developers need to track monthly and daily active users, ARPU, and churn. Other key metrics particular to application providers are downloads and conversion rates. InetSoft's lightweight dashboard application provides easy-to-use app developer tools to design whatever monitoring and analytical dashboards are desired by the marketing function, finance department, or c-suite. Cohort Churn Analytics Another key area for service providers like app developers is customer churn. Grouping by cohorts of app downloaders or periods of acquisition, comparing retention rates provides insights into application preferences, promotional drivers, and version improvements. This kind of dashboards allows monitoring the stickiness of apps, the ultimate key metric for a solution provider. Other important engagement metrics that can be compared across applications and acquisition periods include conversion rates...

Production Management Department Dashboard - When running a business, manufacturing processes must be taken into account in order to ensure a company is on the right track. By observing and analyzing these processes, companies can gain an understanding of the different shifts and trends which progress and hinder their business. This knowledge provides managers with great insight to act accordingly and make decisions in a confident manner. What do project managers need? The answer is a production dashboard to graphically represent the status of each phase of the manufacturing process. InetSoft's StyleBI offers informative dashboard displays using various elements, including charts, tables, diagrams, spreadsheets, etc., which are highly interactive and easily deployed. Using performance data and metrics within a company, InetSoft's production dashboard operates to measure business performance, enabling project managers to face any challenges with ease. InetSoft's StyleBI software offers an easy-to-deploy, and even easier-to-use. Designed with accessibility in mind, businesses can easily adopt this solution. This sample dashboard enables the production manager to track the following KPIs: Number of goods being produced without error. Delays caused by machine downtime. Errors caused by workers. Whereas an executive of the company can: View summary statistics of company profits. Find out who are the major customers. Review safety procedures by measuring worker injuries. With InetSoft's manufacturing and production dashboard, companies can manage and audit the manufacturing process. Workers and managers have the ability to communicate and monitor their activity, as well as receive real-time alerts of under-performance or deviations from plans. Businesses have the advantage of developing and progressing confidently knowing they are on the right path...
Purchase Order Dashboards, KPIs, and Analytics - Purchase order (PO) dashboards have become a core part of modern procurement and finance operations. Instead of digging through spreadsheets, emails, and ERP screens, teams can see the entire purchase lifecycle at a glance: what has been requested, approved, ordered, received, and invoiced. When combined with well-defined key performance indicators (KPIs) and analytics, a purchase order dashboard turns raw transaction data into insight that can improve cost control, supplier performance, and operational efficiency. At their best, PO dashboards are not just “pretty charts.” They are decision-support tools that help buyers, managers, and executives understand where money is going, how quickly orders move, and where risks or bottlenecks are forming. To get there, it is important to understand which KPIs matter, what they mean, and how to influence them through process changes and better collaboration. What is a purchase order dashboard? A purchase order dashboard is a visual interface that consolidates data from purchasing systems—such as ERP, procurement platforms, or accounting software—into a single, interactive view. It typically shows metrics and charts related to...
Reporting Tools for Application Developers - Are you an app developer looking for dashboard software solutions to monitor your portfolio performance? InetSoft offers an easy-to-use performance monitoring tools that can be deployed in days not months. Like all service providers, mobile app developers need to track monthly and daily active users, ARPU, and churn. Other key metrics particular to application providers are downloads and conversion rates. InetSoft's lightweight dashboard application provides easy-to-use app developer tools to design whatever monitoring and analytical dashboards are desired by the marketing function, finance department, or c-suite. Cohort Churn Analytics Another key area for service providers like app developers is customer churn. Grouping by cohorts of app downloaders or periods of acquisition, comparing retention rates provides insights into application preferences, promotional drivers, and version improvements. This kind of dashboards allows monitoring the stickiness of apps, the ultimate key metric for a solution provider. Other important engagement metrics that can be compared across applications and acquisition periods include conversion rates...