Manufacturing Production Dashboards
Manufacturing processes generate volumes of data that must be monitored and analyzed for peak performance and efficiency. By observing and analyzing these processes, companies can gain an understanding of the different shifts and trends which progress and hinder their business. This knowledge provides managers with great insight to act accordingly and make decisions in a confident manner.
What do production managers need? The answer is a production dashboard to graphically represent the status of each phase of the manufacturing process. InetSoft's StyleBI offers informative dashboard displays using various elements, including charts, tables, diagrams, spreadsheets, etc., which are highly interactive and easily deployed.
Using performance data and metrics within a company, InetSoft's production dashboard operates to measure business performance, enabling production managers to face any challenges with ease.

Dashboards Designed with Accessibility in Mind
InetSoft's StyleBI software offers an easy-to-deploy, and even easier-to-use. Designed with accessibility in mind, businesses can easily adopt this solution.
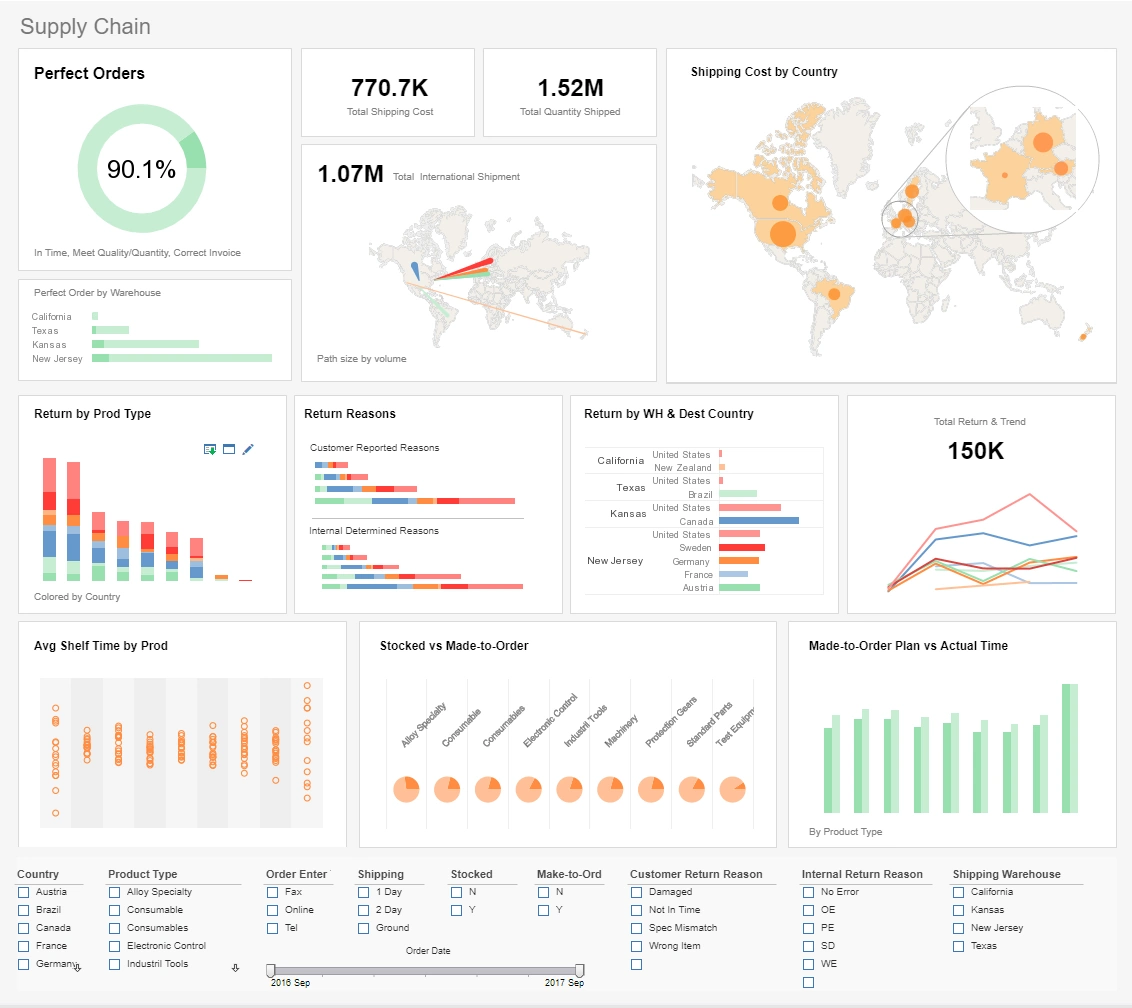
This sample dashboard enables the production manager to track the following KPIs:
- Number of goods being produced without error
- Delays caused by machine downtown
- Errors caused by workers
Whereas an executive of the company can:
- View Summation statistics of company profits
- Find out who are the major customers
- Review safety procedures by measuring worker injuries
With InetSoft's manufacturing and production dashboard, companies can manage and audit the manufacturing process. Workers and managers have the ability to communicate and monitor their activity, as well as receive real-time alerts of under-performance or deviations from plans. Businesses have the advantage of developing and progressing confidently knowing they are on the right path.
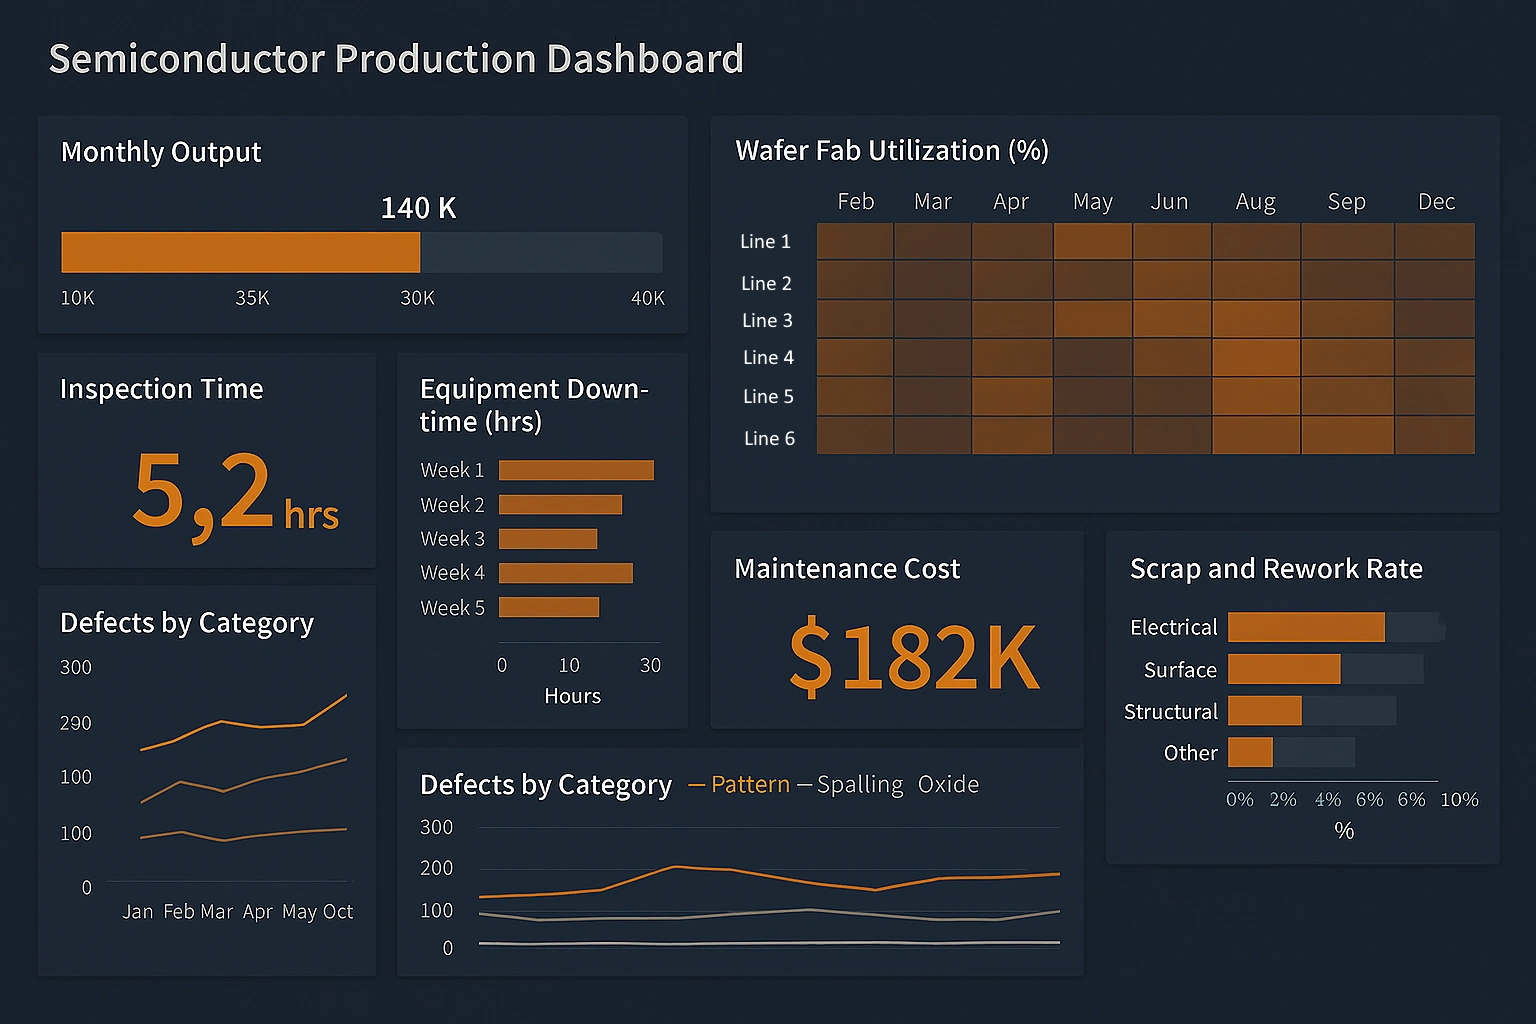
What KPIs and Analytics Does a Semiconductor Manufacturer Use?
- Yield Rate: Yield rate measures the percentage of good, usable chips produced compared to the total number of chips manufactured. It's a crucial indicator of production efficiency and quality control.
- Defect Density: Defect density quantifies the number of defects or faults per unit area of semiconductor wafer. Lower defect densities indicate higher product quality.
- Throughput and Cycle Time: Throughput measures the number of wafers processed per unit of time, while cycle time refers to the time taken to complete a specific manufacturing step. Both KPIs are critical for optimizing production efficiency.
- Equipment Utilization and OEE (Overall Equipment Effectiveness): Equipment utilization calculates the percentage of time that manufacturing equipment is actively used. OEE combines availability, performance, and quality to assess the overall efficiency of equipment.
- Scrap and Rework Rates: Scrap rate measures the percentage of defective or unusable chips in a production batch. Rework rate quantifies the percentage of chips that need to be reprocessed due to defects.
- Process Capability Indices (Cpk): Process capability indices evaluate the capability of a manufacturing process to produce products within specified tolerance limits. Higher Cpk values indicate more precise and controlled processes.
- First Pass Yield (FPY): FPY calculates the percentage of units that pass through the entire manufacturing process without requiring rework or being scrapped. It's a critical metric for assessing production efficiency and cost-effectiveness.
- Mean Time Between Failures (MTBF) and Mean Time to Repair (MTTR): MTBF measures the average time between equipment failures, while MTTR quantifies the average time taken to repair equipment. These metrics are crucial for maintaining equipment reliability and minimizing downtime.
- Inventory Turns: Inventory turns assess how efficiently raw materials and finished goods are utilized in the manufacturing process. Higher turns indicate better inventory management.
- Wafer Fab Utilization: This KPI evaluates the percentage of time that the wafer fabrication facility is in use. It helps optimize resource allocation and capacity planning.
- Cost per Wafer and Cost per Die: These metrics assess the cost-effectiveness of the manufacturing process by evaluating the expenses associated with producing each wafer and individual die.
- Customer Return Rate: This KPI measures the percentage of products returned by customers due to defects or quality issues. It provides valuable feedback on product quality and customer satisfaction.

About InetSoft
Since 1996 InetSoft has been delivering easy, agile, and robust business intelligence software that makes it possible for organizations and solution providers of all sizes to deploy or embed full-featured business intelligence solutions.Application highlights include visually-compelling and interactive dashboards that ensure greater end-user adoption plus pixel-perfect report generation, scheduling, and bursting.
InetSoft's patent pending Data Block™ technology enables productive reuse of queries and a unique capability for end-user defined data mashup. This capability combined with efficient information access enabled by InetSoft's visual analysis technologies allows maximum self-service that benefits the average business user, the IT administrator, and the developer.InetSoft solutions have been deployed at over 5,000 organizations worldwide, including 25% of Fortune 500 companies, spanning all types of industries.

More Articles for Evaluators of Manufacturing Dashboards
Articles about InetSoft's Dashboard Development Tools - Are you an app developer looking for dashboard software solutions to monitor your portfolio performance? Any user can come in and create a data worksheet, and then another user can create a dashboard or report based on that data worksheet as long as they have permission to view that data worksheet...
Evaluate InetSoft's Drag and Drop Dashboard Builder - Are you looking for a good drag and drop dashboard builder? InetSoft's pioneering dashboard application produces great-looking web-based dashboard with an easy-to-use drag and drop designer. Get cloud-flexibility for your deployment. Minimize costs with a small-footprint solution. Maximize self-service for all types of users. No dedicated BI developer required. View a demo and try interactive examples...
Example of Value of Frontline Real-Time BI - If there's a product issue in the engineering process, and you're starting to see the linkages between a poorly engineered product and warranty and quality issues and the amount of cost that's occurring because of the extra service for that product, do those organizations communicate and understand this, and are they able to proactively detect what's...

Good Industrial Reporting Software - Are you looking for good industrial reporting software? For business intelligence applications, it's often a gradual process of first effectively utilizing basic production reports then increasing end-user self-service with more sophisticated business intelligence tools . Instead of providing...
Interactive Health Information Dashboard - Filter by state, population, or specific query. Analyze charts and graphs and then select other tabs to see other views or drilldown into details. View data from multiple sources and formats on one dynamic screen. Create bookmarks of favorite views...
Quality Metrics to Consider - Training penetration rate Time-to-market of new products/services Average number of training hours per employee Ratio, Data Accuracy Ratio, Data Duplication Quality personnel to normal personnel ratio Average time from idea to first patent filing % of rejected patents...
Reporting & Publishing Features - Business Logic - add server-side JavaScript for run-time presentation control Modular Design - combine elements such as tables, charts, and sub-reports, to create a complete report Scheduling - monitor and schedule batch report generation with multiple output and delivery channels Multiple Crosstab Aggregations - use data aggregation methods like sum, average, correlation, variance, percentage of total, etc. and multiple levels of ungrouping in both directions...