Financial Reporting
Finance departments are challenged everyday with more reporting demands by executives, boards and external agencies. This diverse audience also increasingly wants more transparent and quicker responses. On the other hand, CFOs want more analysis to discover opportunities and insights.
Visual Finance Analysis
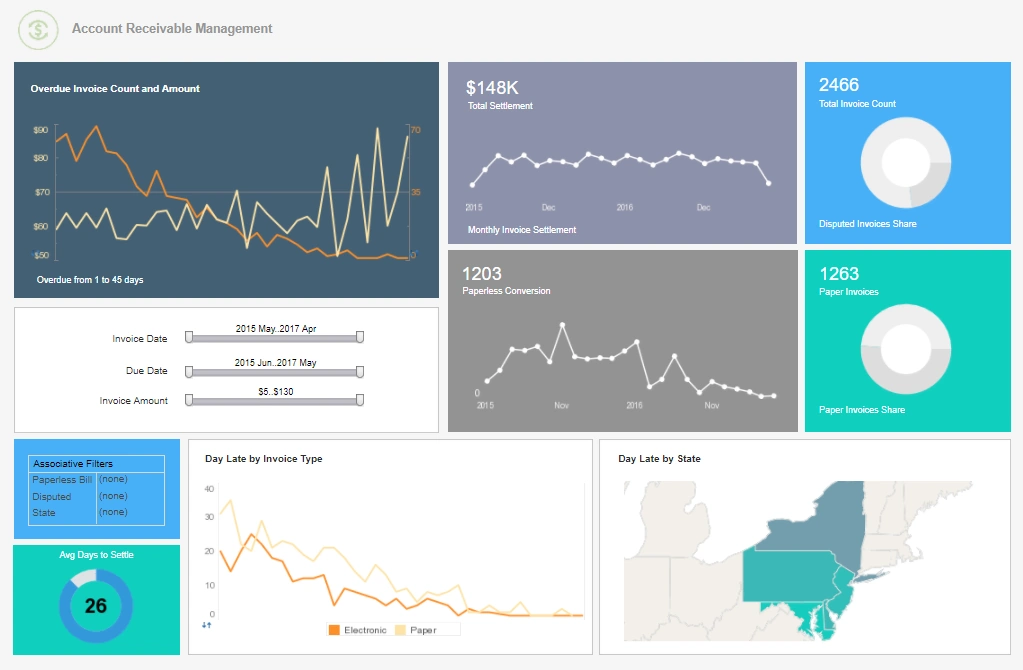
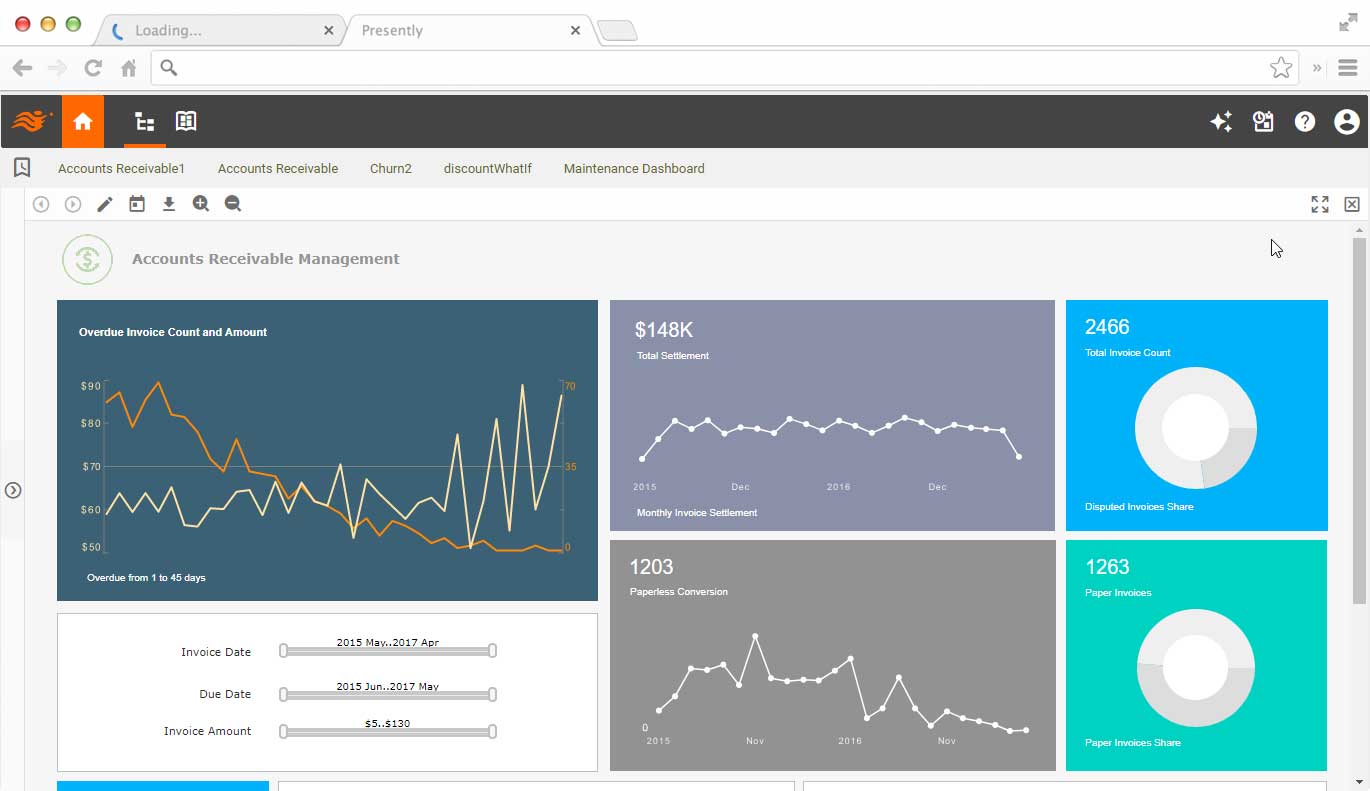
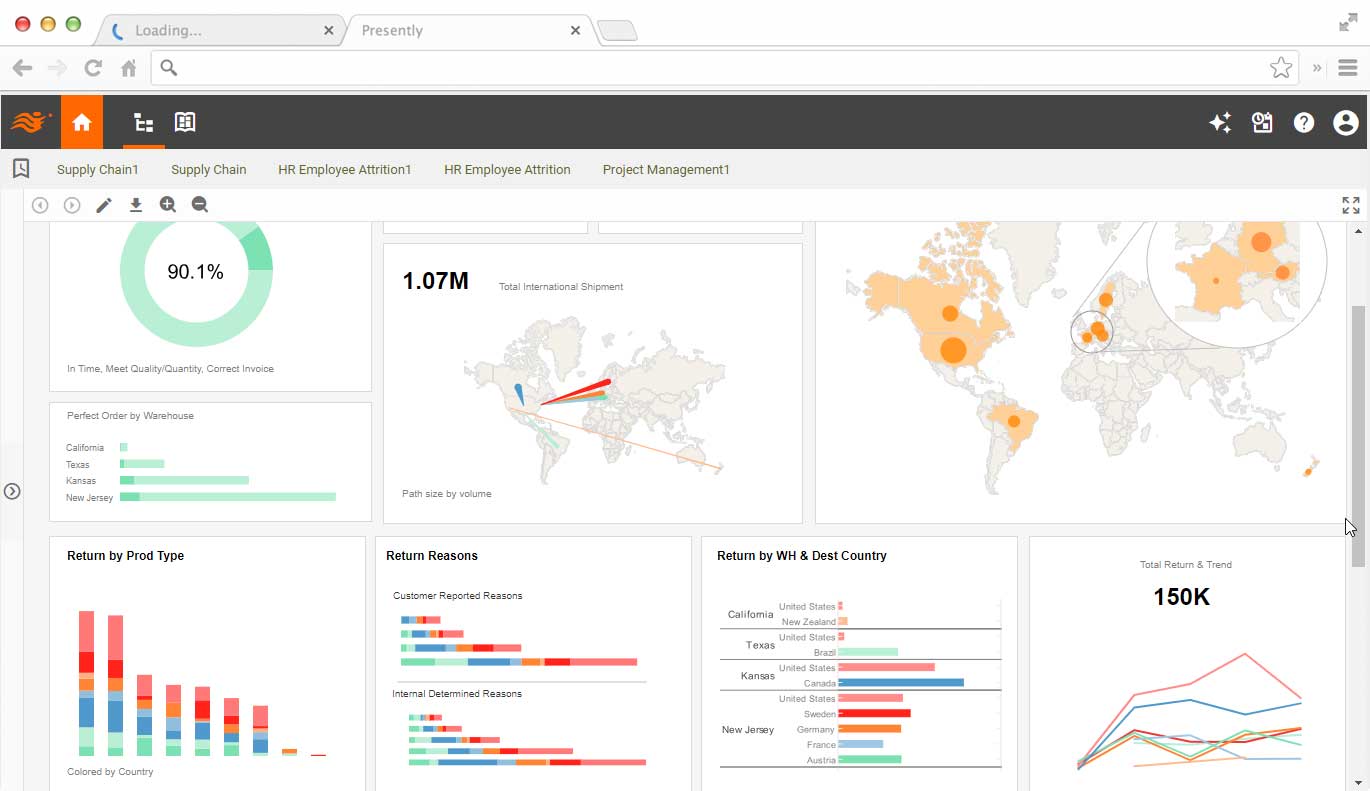
Self-Service Finance Visual Dashboards
Visualization dashboards with rich interactive functions empower finance professionals with unprecedented self-service information and exploration. This, in turn, minimizes follow-up explanation otherwise needed by information consumers.
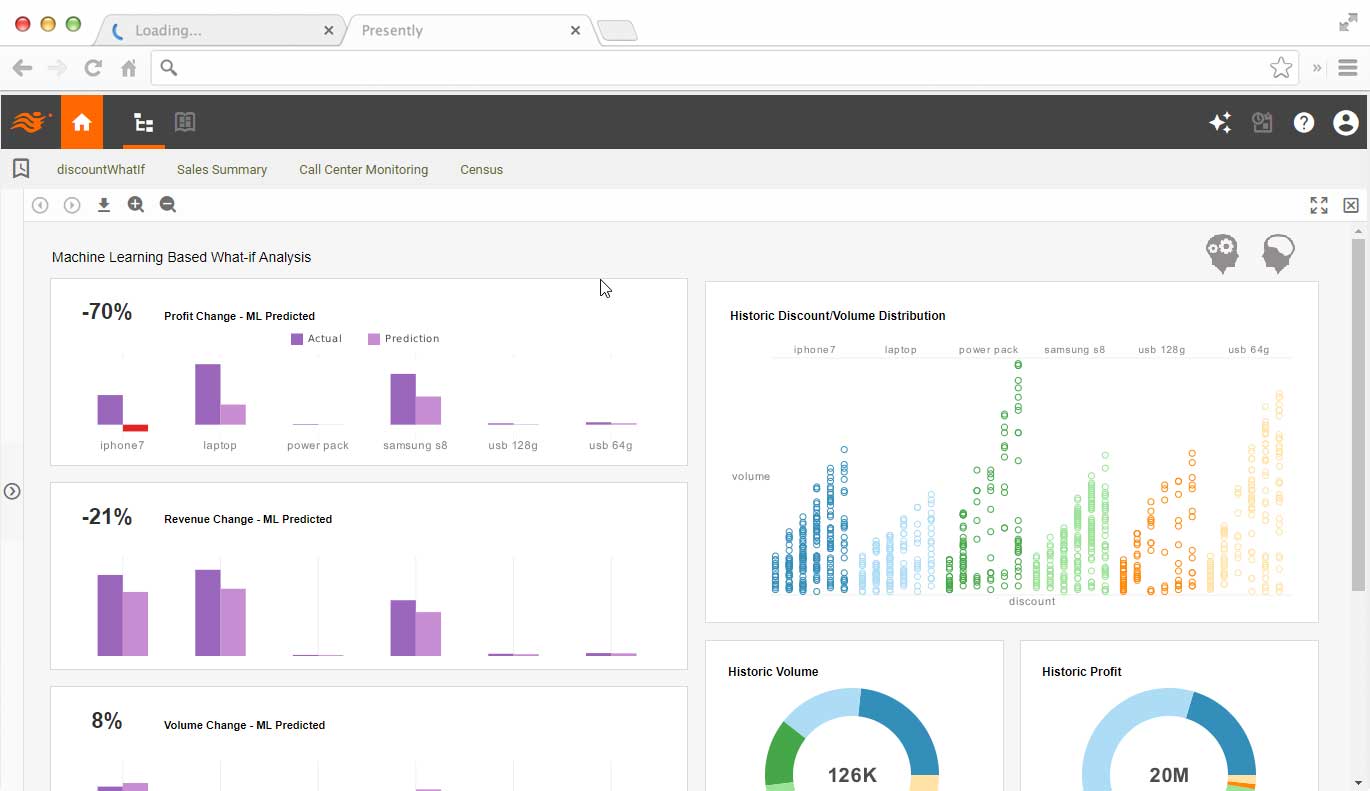
Machine Learning Powered Forecasts and Insights
Machine learning uses accumulated data for forecasting, the discovery of irregularities, and for auditing. It not only saves finance professionals precious time but also delivers findings that are hidden in data.
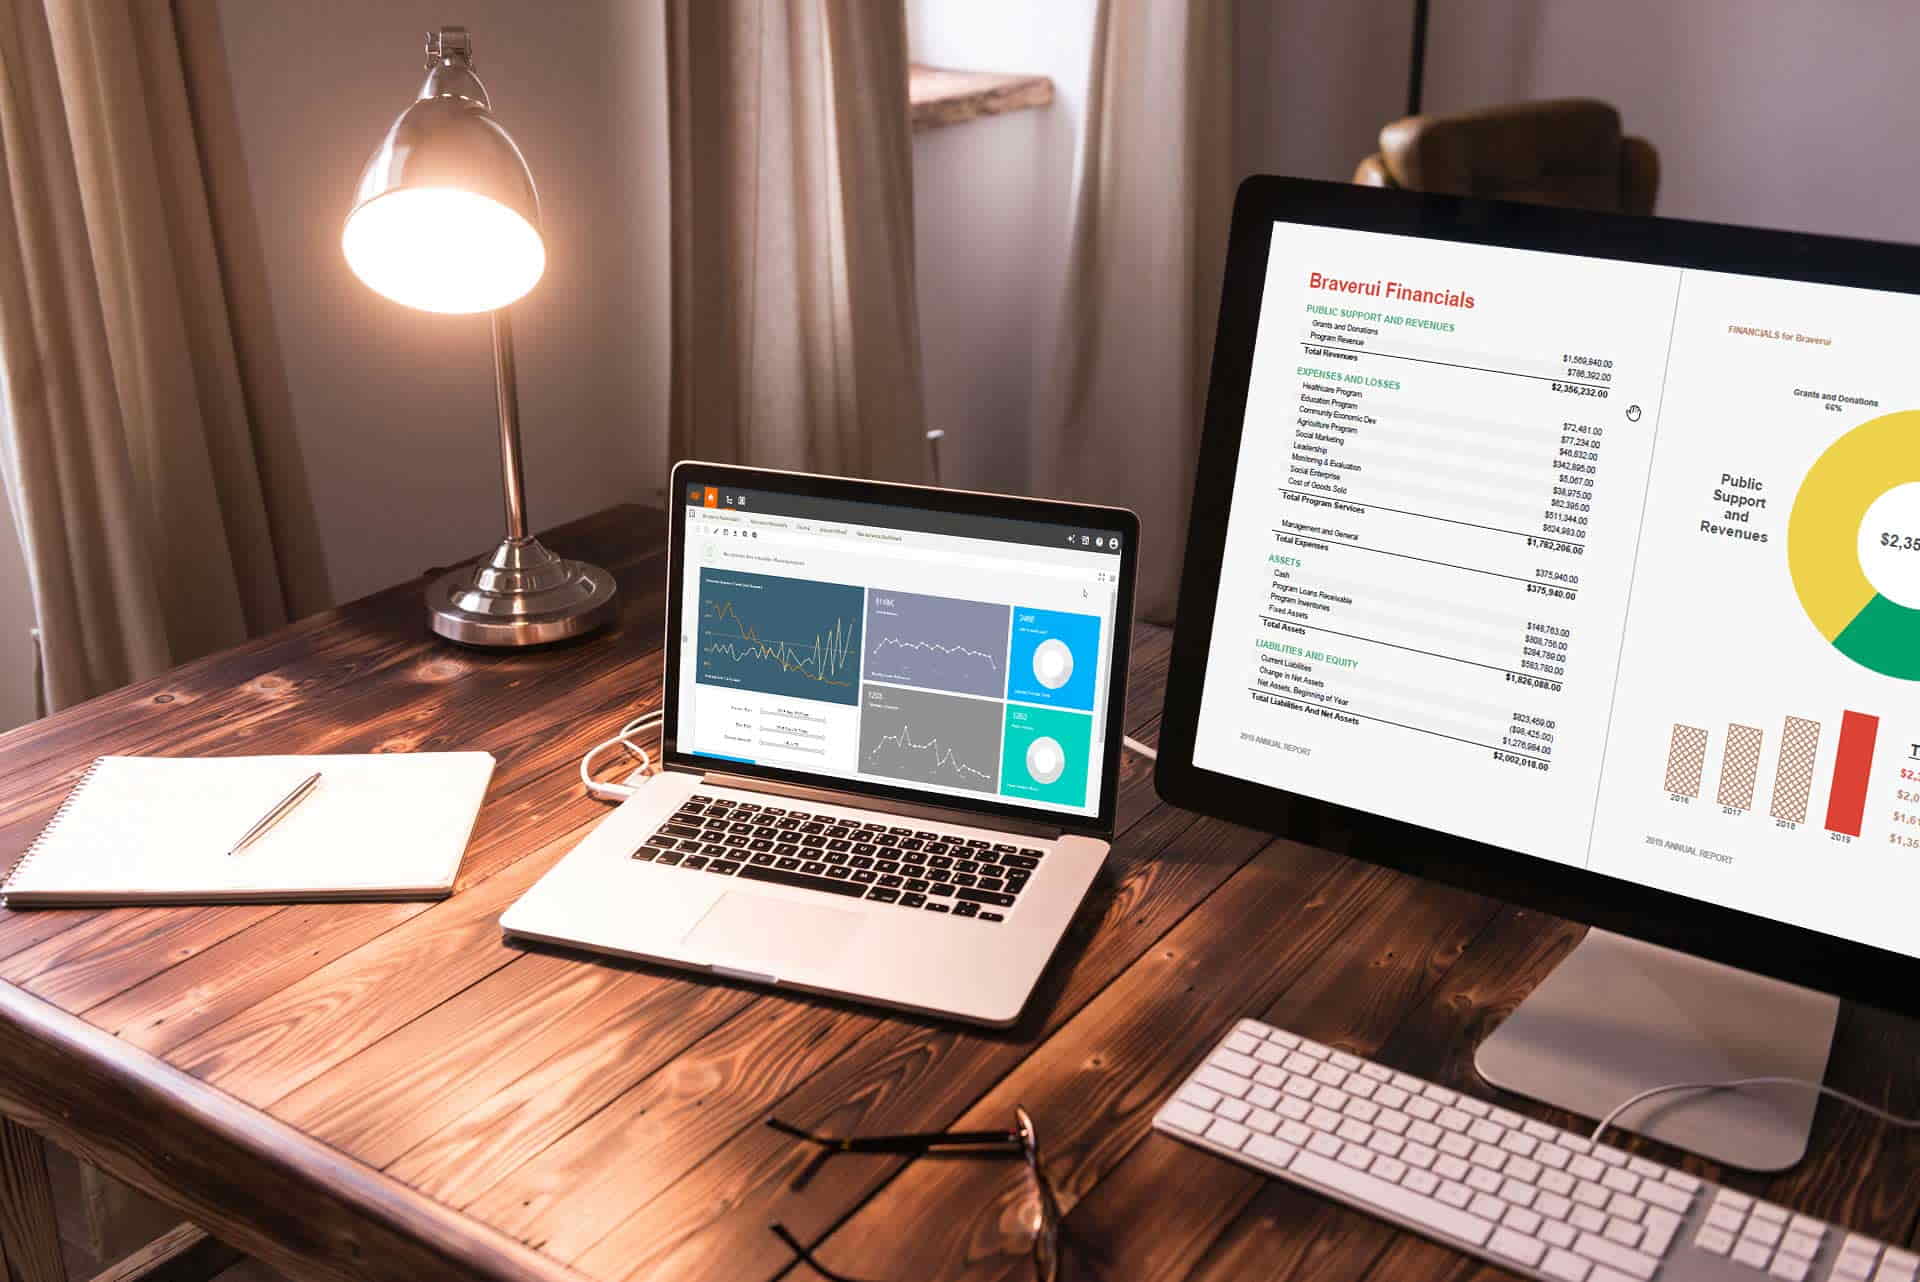
Online and Offline Finance Reporting and Statements
InetSoft's data intelligence software further provides pixel-perfect document reports. Document reports are especially suitable for dual online and offline use. When used online, a document report is live with interactive functions such as streaming, searching and page jumping. The paginated nature of document reports allows large amounts of formatted information be delivered to customers or external entities easily.
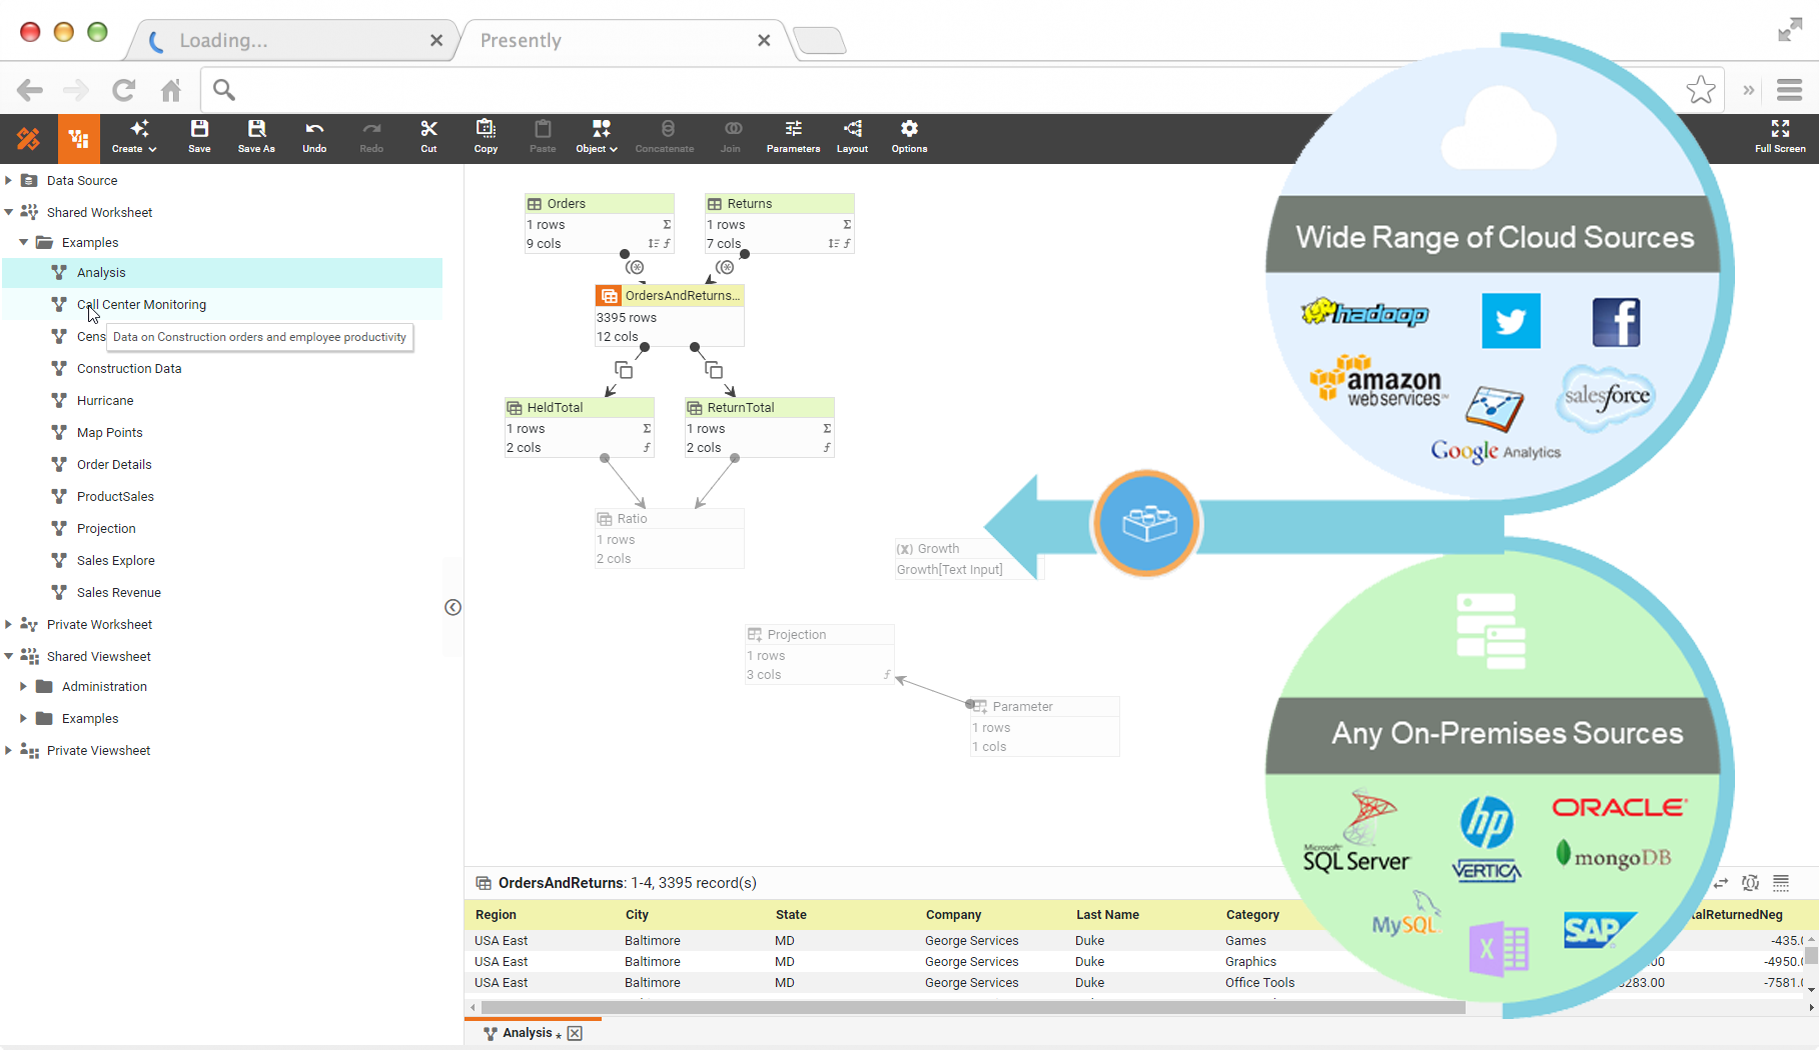
Finance Data Consolidation and Mashup
The finance department interacts with many areas. Consolidating data from various systems and departments can be a very challenging task. This often is the source of spreadsheet hell that breaks data lineage and causes inconsistent reporting. InetSoft's data mashup technology is an elegant solution.
Data mashup is designed for business analysts. With rich connections to enterprise software data sources, business analysts can further mix in Excel data to do tasks such as experimenting with forecasted model data.
Other Sample Finance Analysis
- Expense monitoring and management
- Risk management and audits
- Procurement and supply chain management
- What-if scenario modeling
What Data Visualizations Do Financial Reporting Managers Create?
Financial reporting managers utilize data visualizations to communicate complex financial information effectively, facilitate decision-making, and provide insights to stakeholders. Here are several types of data visualizations commonly used in financial reporting:
-
Income Statements: Financial reporting managers use visualizations such as vertical bar charts or waterfall charts to represent income statements. These visualizations help stakeholders understand revenue, expenses, and profitability over a specific period, highlighting key components such as gross profit, operating income, and net income.
-
Balance Sheets: Visualizations like stacked bar charts or treemaps are used to illustrate balance sheet data, including assets, liabilities, and equity. These visualizations enable stakeholders to see the composition of the company's financial position, identify trends in asset allocation, and assess liquidity and solvency.
-
Cash Flow Statements: Financial reporting managers use line graphs or area charts to visualize cash flow statements, depicting cash inflows and outflows from operating, investing, and financing activities. These visualizations help stakeholders understand the sources and uses of cash, assess cash flow trends over time, and evaluate the company's ability to generate and manage cash.
-
Financial Ratios: Visualizations such as radar charts or bullet graphs are used to present financial ratios, including liquidity ratios, profitability ratios, and leverage ratios. These visualizations allow stakeholders to compare performance metrics against benchmarks, track trends over time, and assess the company's financial health and performance relative to peers or industry standards.
-
Trend Analysis: Financial reporting managers use line charts, area charts, or sparklines to depict trends in key financial metrics such as revenue, expenses, profit margins, and stock prices over time. These visualizations help stakeholders identify patterns, seasonality, and long-term trends in financial performance, informing strategic decision-making and forecasting.
-
Variance Analysis: Visualizations like waterfall charts or column charts with variance bars are used to analyze and explain variances between actual and budgeted or forecasted figures. These visualizations help stakeholders understand the drivers of variances, whether they are due to changes in volume, price, cost, or other factors, enabling corrective actions to be taken as needed.
-
Geospatial Analysis: Financial reporting managers may use maps or heat maps to visualize revenue, expenses, or market share geographically. These visualizations help stakeholders identify regional trends, market opportunities, and potential risks, informing expansion strategies, resource allocation decisions, and risk management efforts.
-
Dashboard Reporting: Financial reporting managers may design interactive dashboards with various visualizations to provide a comprehensive overview of financial performance, key metrics, and KPIs. Dashboards may include charts, graphs, tables, and other visual elements to enable stakeholders to explore data, drill down into details, and monitor performance in real-time.
More Resources About Financial Dashboards
Evolving CFO Business Intelligence - So first let's talk about the evolving role of Finance. Now traditionally people in the finance department have been more in back office I would say, more operation, more tactical and focused. They handle things like statutory reporting, management reporting, and they close the books every month...
Financial Metrics for Startups - Startup owners should understand the significance of effectively managing working capital as it helps keep financial security and avoid bankruptcy. Here are some steps for successful management...
Value of KPIs in Budgeting - KPIs offer measurements that show if departments are meeting the standards required to keep profitable operations. Potential leads and sales, average sales for each cycle, and conversion rates are a few examples of pertinent KPIs. These metrics assess the effectiveness of the sales processes and enable teams...