Dashboard Reporting Tools for Application Developers
Are you an app developer looking for dashboard software solutions to monitor your portfolio performance? InetSoft offers easy-to-use performance monitoring tools that can be deployed in days not months.
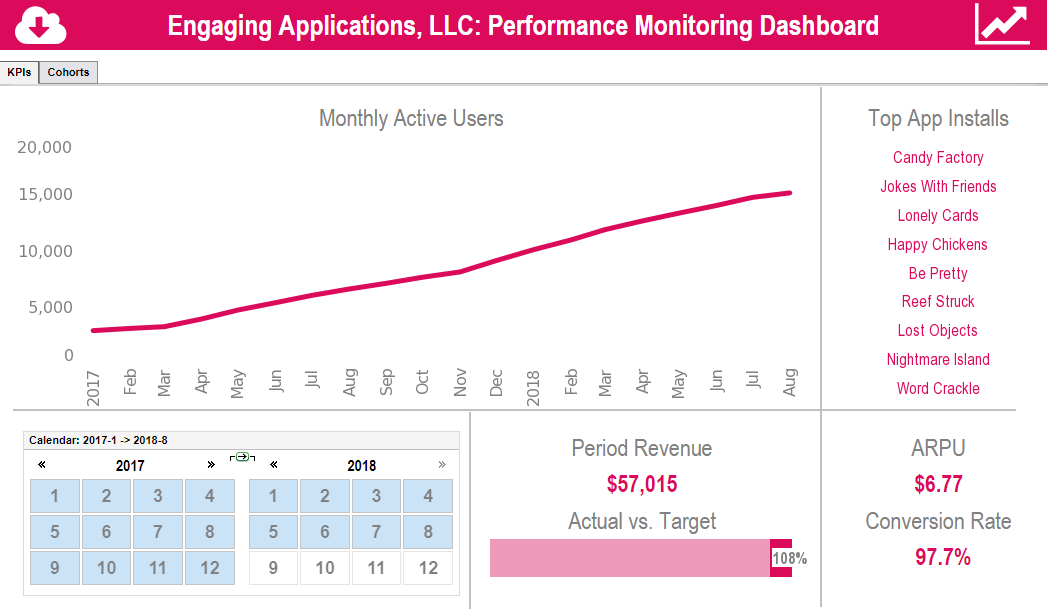
Like all service providers, mobile app developers need to track monthly and daily active users, ARPU, and churn. Other key metrics particular to application providers are downloads and conversion rates.
InetSoft's lightweight dashboard application provides easy-to-use app developer tools to design whatever monitoring and analytical dashboards are desired by the marketing function, finance department, or c-suite.

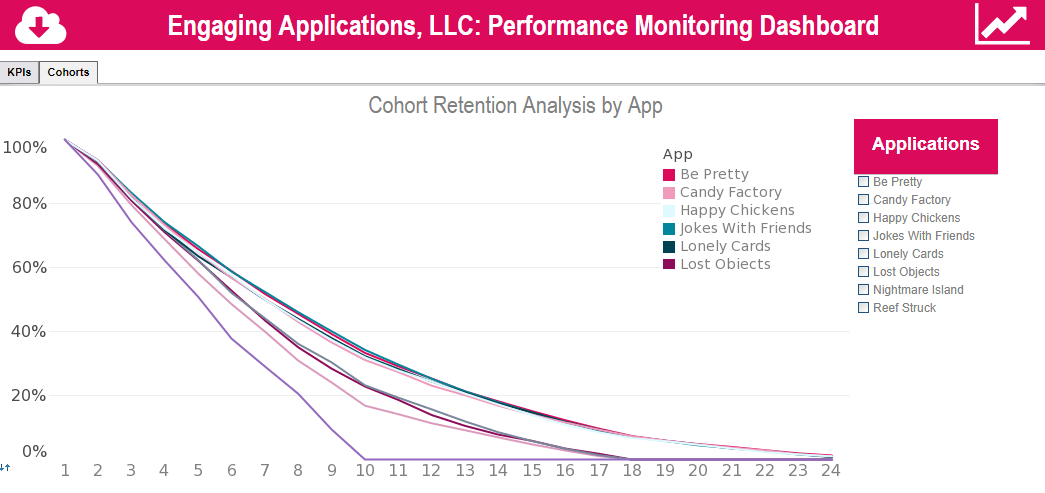
Cohort Churn Analytics
Another key area for service providers like app developers is customer churn. Grouping by cohorts of app downloaders or periods of acquisition, comparing retention rates provides insights into application preferences, promotional drivers, and version improvements.
This kind of dashboard allows monitoring the stickiness of apps, the ultimate key metric for a solution provider. Other important engagement metrics that can be compared across applications and acquisition periods include conversion rates.
What KPIs Do Gaming Application Developers Track?
Here are some common KPIs tracked by gaming application developers:
- Player Engagement Metrics:
- Daily Active Users (DAU): The number of unique users who engage with the game on a daily basis, indicating the game's popularity and retention rate.
- Monthly Active Users (MAU): The number of unique users who engage with the game within a calendar month, providing insights into long-term user engagement and audience reach.
- Session Length: Average duration of gameplay sessions, measuring player immersion, enjoyment, and retention within the game.
- User Acquisition and Retention:
- Installs: The total number of downloads or installations of the game across various platforms and distribution channels, tracking user acquisition efforts.
- Retention Rate: Percentage of users who continue to engage with the game over time, typically measured at regular intervals (e.g., 1 day, 7 days, 30 days) after installation or first gameplay.
- Monetization Metrics:
- Average Revenue per User (ARPU): Total revenue generated divided by the number of active users, indicating the average monetization potential of each player.
- Average Revenue per Paying User (ARPPU): Total revenue generated from paying users divided by the number of paying users, measuring the average spending behavior of paying players.
- Conversion Rate: Percentage of users who make in-app purchases or subscribe to premium features, reflecting the effectiveness of monetization strategies and in-game offerings.
- In-Game Metrics:
- Retention Churn Rate: Percentage of users who stop playing the game over a specific period, measuring player attrition and churn rate.
- Level Progression: Percentage of players who complete specific levels, missions, or objectives within the game, indicating progression and engagement.
- Social Interactions: Metrics related to social features and interactions within the game, such as friend invitations, multiplayer matches, or in-game messaging.
- Performance Metrics:
- Frames per Second (FPS): Average frame rate or rendering performance of the game, ensuring smooth gameplay experience and optimization for different devices and hardware configurations.
- Crash Rate: Percentage of game sessions that result in crashes or technical issues, assessing stability and reliability of the game across different platforms and operating systems.
- User Feedback and Ratings:
- App Store Ratings: Average user ratings and reviews on app stores (e.g., Apple App Store, Google Play Store), reflecting user satisfaction, sentiment, and feedback.
- User Surveys: Solicited feedback from players through in-game surveys, polls, or feedback forms, providing qualitative insights into player preferences, suggestions, and areas for improvement.
- Social and Community Engagement:
- Social Sharing and Referral Metrics: Tracks the number of shares, invites, and referrals generated by players through social media channels, fostering virality and organic user growth.
- Community Interaction Metrics: Measures user engagement with community forums, in-game chat features, and social platforms, assessing the strength of the player community and facilitating player feedback and support.
- Technical Performance and Stability:
- App Crashes and Errors: Monitors the frequency and severity of app crashes, bugs, glitches, and technical issues encountered by players, ensuring a smooth and stable gameplay experience.
- Load Times and Performance Metrics: Measures loading times, latency, frame rates, and other performance indicators to optimize game performance across different devices and network conditions.
- Churn and User Drop-off:
- Churn Rate: Calculates the percentage of players who stop playing the game or uninstall the app over a specific period, identifying churn patterns and potential reasons for player attrition.
- Drop-off Points: Identifies specific stages, levels, or features within the game where players are most likely to drop off or disengage, enabling targeted interventions to improve retention and engagement.
- In-Game Economy and Virtual Goods:
- Conversion Rate to Paying Users: Measures the percentage of players who convert from non-paying users to paying users by making in-app purchases or transactions.
- Average Revenue per Paying User (ARPPU): Calculates the average revenue generated per paying user, assessing the spending behavior and purchasing power of the game's paying audience.
- Long-Term User Value and Lifetime Value (LTV):
- Lifetime Value of a Player (LTV): Estimates the total revenue expected to be generated by a player over their lifetime engagement with the game, taking into account retention, monetization, and churn rates.
- Return on Investment (ROI): Evaluates the profitability of user acquisition and marketing campaigns by comparing the lifetime value of acquired users with the cost of acquisition, ensuring positive ROI and efficient allocation of marketing budgets.
About InetSoft
InetSoft is a pioneer in delivering easy, agile, and robust business intelligence software that makes it possible for organizations and solution providers of all sizes to deploy or embed full-featured business intelligence solutions. Application highlights include visually-compelling and interactive dashboards that ensure greater end-user adoption plus pixel-perfect report generation, scheduling, and bursting. InetSoft's patent pending Data Block technology enables productive reuse of queries and a unique capability for end-user defined data mashup. This capability combined with efficient information access enabled by InetSoft's visual analysis technologies allows maximum self-service that benefits the average business user, the IT administrator, and the developer. InetSoft solutions have been deployed at over 5,000 organizations worldwide, including 25% of Fortune 500 companies, spanning all types of industries.


