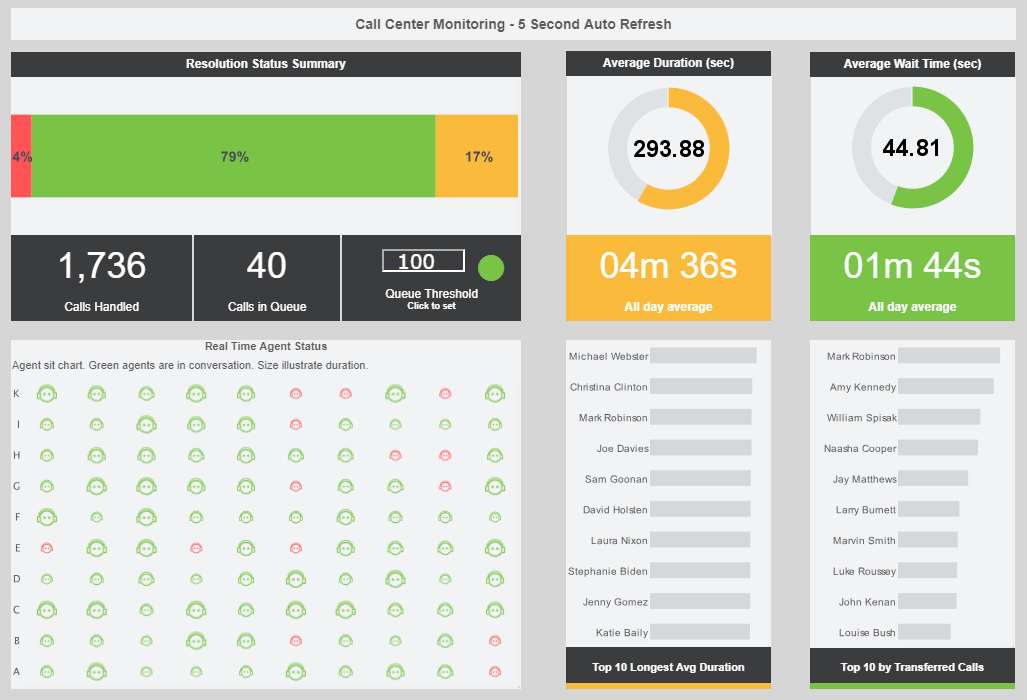
Interactive Dashboards
and
Maximum Self-Service
Powered by a Data Mashup Engine


Customer Service is the Best I've Encountered!
All the technicians are extremely knowledgeable, patient and will make every effort to accommodate your schedule and resolve the issue in a timely manner. - Jack from BOK Financial
Great Product and Easy to Use
I have been using this product for almost 2 years, and I find it simple to use and gives reliable results. I recently had a team trying to create a report for 2 weeks with another BI product. Since they couldn't build what they needed they came back to me. I was able to get it for them in less than a day with InetSoft. - Steven from Endurance Services
Explore Live Examples & Get Pricing Details
InetSoft does not sell or share your personal information to any third parties. Our privacy policy is available here.
Sample Customers





|





|
 |
Learn about the top 10 features of embedded business intelligence. |
How Does the Municipal Public Works Department Use a Performance Dashboard Application?
A Municipal Public Works Department typically uses a Performance Dashboard Application to enhance efficiency, transparency, and decision-making in the management of various public services and infrastructure. Here's how such a department might utilize a performance dashboard:
- Real-time Monitoring:
- Infrastructure Status: The dashboard can provide real-time updates on the condition of roads, bridges, water systems, and other infrastructure, allowing officials to monitor for issues and prioritize maintenance.
- Resource Allocation:
- Budget Tracking: A performance dashboard helps track budget allocations and expenditures for different projects and services, ensuring that resources are used effectively and in line with established budgets.
- Service Requests and Work Orders:
- Work Order Management: The dashboard can integrate data on service requests, work orders, and completion status. This allows the department to streamline workflows, assign tasks efficiently, and ensure timely resolution of issues.
- Maintenance Planning:
- Predictive Maintenance: By analyzing historical data on infrastructure maintenance, the dashboard can support predictive maintenance strategies, helping the department address potential problems before they become critical.
- Performance Metrics:
- Key Performance Indicators (KPIs): The dashboard can display KPIs related to service delivery, such as response times for emergency services, completion rates for projects, and customer satisfaction metrics.
- Asset Management:
- Inventory Tracking: For departments managing assets like vehicles, equipment, and facilities, the dashboard can provide insights into asset utilization, maintenance schedules, and replacement planning.
- Public Communication:
- Information Sharing: Some dashboards offer public-facing features, allowing the department to share relevant information with residents. This can include updates on ongoing projects, road closures, and other important announcements.
- Compliance and Regulations:
- Regulatory Compliance: The dashboard can assist in tracking compliance with regulations and standards, ensuring that the department meets legal and safety requirements.
- Data Analysis and Reporting:
- Trend Analysis: Data collected and displayed on the dashboard can be analyzed to identify trends, patterns, and areas for improvement, aiding in strategic decision-making.
- Collaboration:
- Interdepartmental Collaboration: The dashboard can facilitate collaboration between different municipal departments by providing a centralized platform for sharing relevant data and information.
What Are Some Projects That a Municipal Public Works Department Keeps Track of?
A Municipal Public Works Department is responsible for managing a diverse range of projects that contribute to the overall infrastructure, safety, and well-being of the community. Here are some common projects that a Public Works Department typically keeps track of:
- Road Construction and Maintenance:
- New road construction.
- Road resurfacing and repair projects.
- Traffic signal installation and maintenance.
- Bridges and Culverts:
- Bridge construction and maintenance.
- Culvert installation and repair.
- Water and Sewer Systems:
- Water main installation and repair.
- Sewer system maintenance and upgrades.
- Stormwater management projects.
- Public Buildings and Facilities:
- Construction and maintenance of municipal buildings.
- Upgrades to community centers, libraries, and other public facilities.
- Park and Recreation Projects:
- Park development and maintenance.
- Installation of recreational facilities (playgrounds, sports fields, etc.).
- Trail construction and maintenance.
- Solid Waste Management:
- Implementation of recycling programs.
- Landfill management and expansion projects.
- Traffic Management and Signage:
- Installation of traffic signs and signals.
- Traffic calming measures.
- Pedestrian and cyclist safety projects.
- Street Lighting:
- Installation and maintenance of streetlights.
- Conversion to energy-efficient lighting technologies.
- Public Transportation:
- Public transit system improvements.
- Bus stop construction and maintenance.
- Emergency Response and Preparedness:
- Disaster preparedness projects.
- Infrastructure improvements for emergency services.
- Environmental Initiatives:
- Green infrastructure projects (green roofs, permeable pavements).
- Tree planting and maintenance programs.
- Utility Infrastructure:
- Gas line installation and maintenance.
- Electric grid upgrades.
- Technology Integration:
- Implementation of smart city technologies.
- Upgrades to communication and information systems.
- Community Development:
- Affordable housing projects.
- Neighborhood revitalization initiatives.
- Public Art and Streetscape Projects:
- Installation of public art and sculptures.
- Streetscape beautification projects.
- GIS Mapping and Data Management:
- Geographic Information System (GIS) mapping projects.
- Data collection and management initiatives.
- Water Treatment and Distribution:
- Water treatment plant upgrades.
- Expansion of water distribution systems.
 |
Read how InetSoft was rated as a top BI vendor in G2 Crowd's user survey-based index. |
More Articles About Departmental Performance Dashboards
Geographic Data in a Sales Coverage Dashboard - Sales coverage considers not only the volume of leads but also their quality and pertinence to your company. Optimizing your sales approach may be revolutionized by analyzing the demographic and geographic information of your leads. Geographic Reach: This measure evaluates the source of your leads. It facilitates the distribution of resources and the identification of growth areas...
Lead Distribution Explained - Lead distribution implies the assignment of potential customers or leads to the various members of a sales team. The proficiency of this distribution can greatly impact a business's financial performance, emphasizing the importance of robust lead distribution software. Lead distribution software transcends the purpose of a digital registry. It is a powerful tool, ingeniously designed to assign leads based on a set...
Performance Management Chart Articles - You can use InetSoft's BI software to quickly and easily create any kind of performance management chart you wish. From speedometers to thermometers to traffic lights, you can use any imagery you like. Popular chart types like bullet charts showing percent of goal attainment are also possible. Read articles below for more information, or watch a 2-minute demo...
Weekly Report Distribution Software - Regular reports are vital for the monitoring and control of business conditions. But in many cases, the production of daily, weekly, monthly, and annual reports puts additional demands on administrators and employees. And with so much business travel and work done out in the field, report accessibly and deliverability can also be an issue. Our solution, Style Report, makes the setting up and delivery of weekly reports easy...
