How An Unmanned and Autonomous Systems Manufacturer Uses Data Mashup in Their Applications in Enterprise Data Analytics
A global manufacturer of unmanned and autonomous systems faced a familiar problem. Data lived in many places and each team saw only a fragment of the truth. Engineering tracked telemetry and test results in specialized databases.
Operations monitored production metrics in an on premises ERP system.Sales and service teams relied on cloud based CRM and ticketing platforms.
Leadership wanted a single analytical environment that could connect these islands of information without waiting for a multi year warehouse project.
The company selected InetSoft and centered its analytics strategy on the InetSoft Data Mashup engine. This decision allowed them to create virtual datasets that combined telemetry, production, quality, and customer data in a governed and repeatable way. The result was an enterprise analytics layer that supported both day to day decisions and long term product strategy.
Complex data landscape in unmanned systems manufacturing
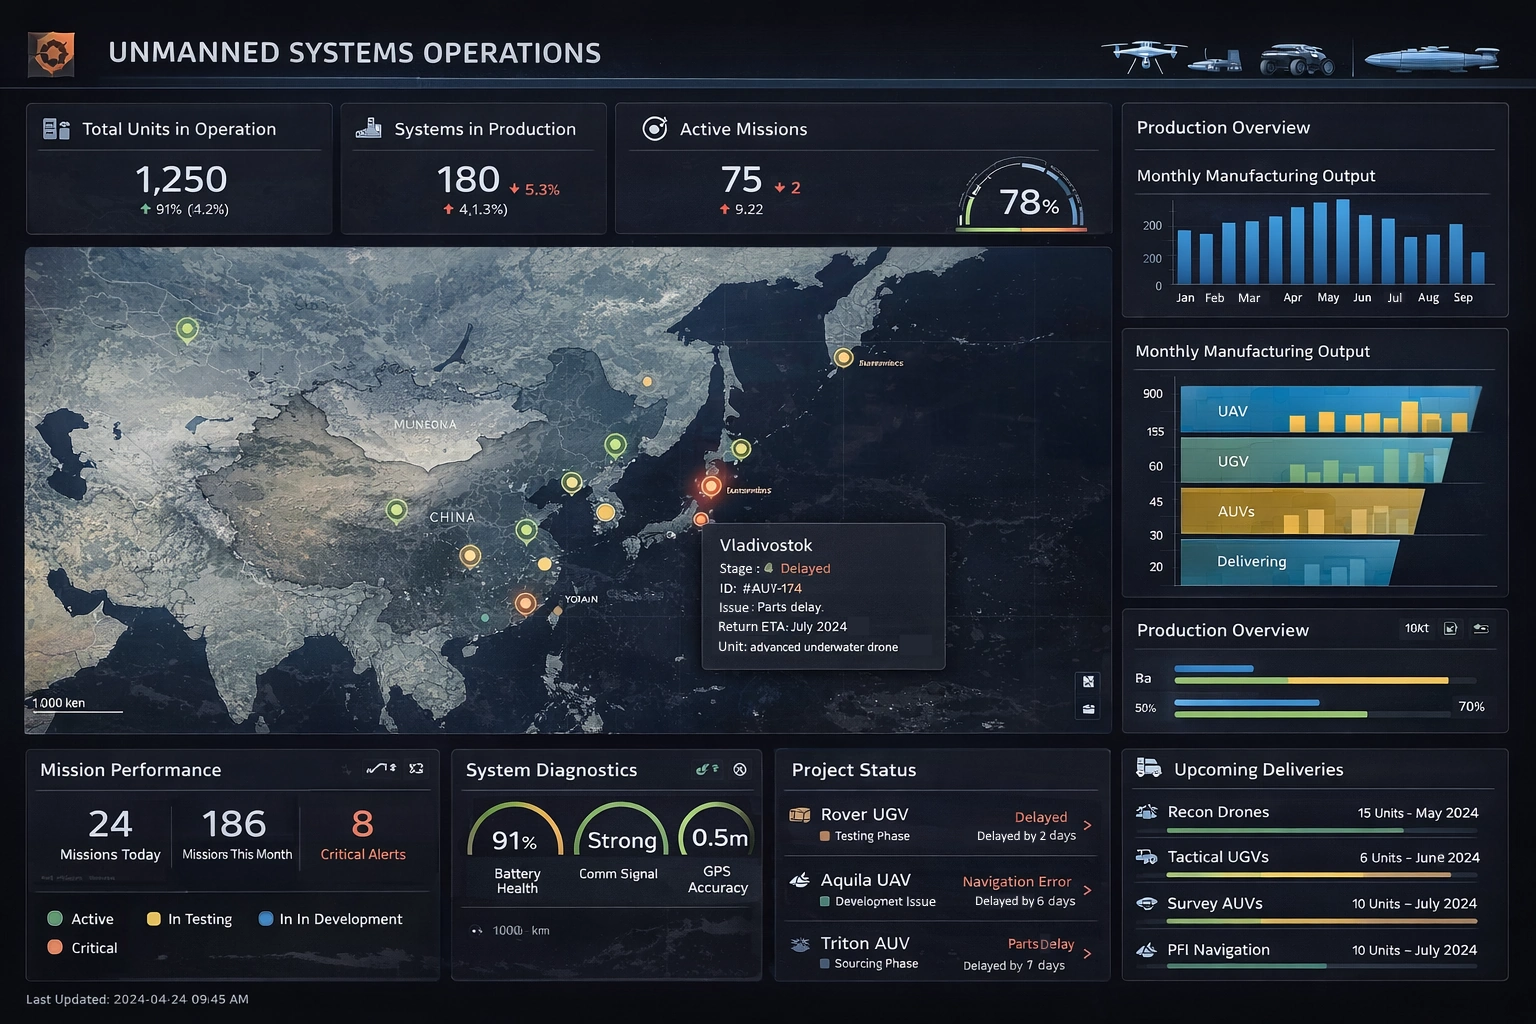
Unmanned and autonomous systems generate large volumes of data. Each vehicle or platform produces telemetry streams that capture sensor readings, navigation data, and system health indicators. During development and testing these streams are stored in time series databases and file based repositories. Once systems move into production additional data sources appear. Manufacturing execution systems record cycle times and defect rates. Supply chain systems track component availability and lead times. Service systems record maintenance events and field failures.
Before InetSoft the manufacturer relied on manual extracts and spreadsheets to combine these sources. Engineers exported telemetry summaries and emailed them to operations analysts. Operations exported production data from the ERP system. Service teams pulled CSV files from their ticketing platform. Each group built its own version of the truth which made it difficult to answer cross functional questions such as which design changes reduced field failures or which suppliers contributed most to rework.
InetSoft Data Mashup engine as a unifying layer
The InetSoft Data Mashup engine provided a way to connect to each source system and define reusable data blocks. One block represented test and telemetry summaries by platform and configuration. Another block represented production and quality metrics by serial number and build date. A third block represented service tickets and maintenance events by asset and customer. Each block encapsulated connection details, joins, filters, and calculated fields.
Data architects then used these blocks to create semantic views that aligned with business questions. For example a Reliability view joined telemetry summaries with production data and service events. A Program Performance view combined contract level financials with delivery milestones and defect trends. These views became the foundation for dashboards and ad hoc analysis across engineering, operations, and customer support.
Key use cases enabled by data mashup
Closed loop reliability analytics
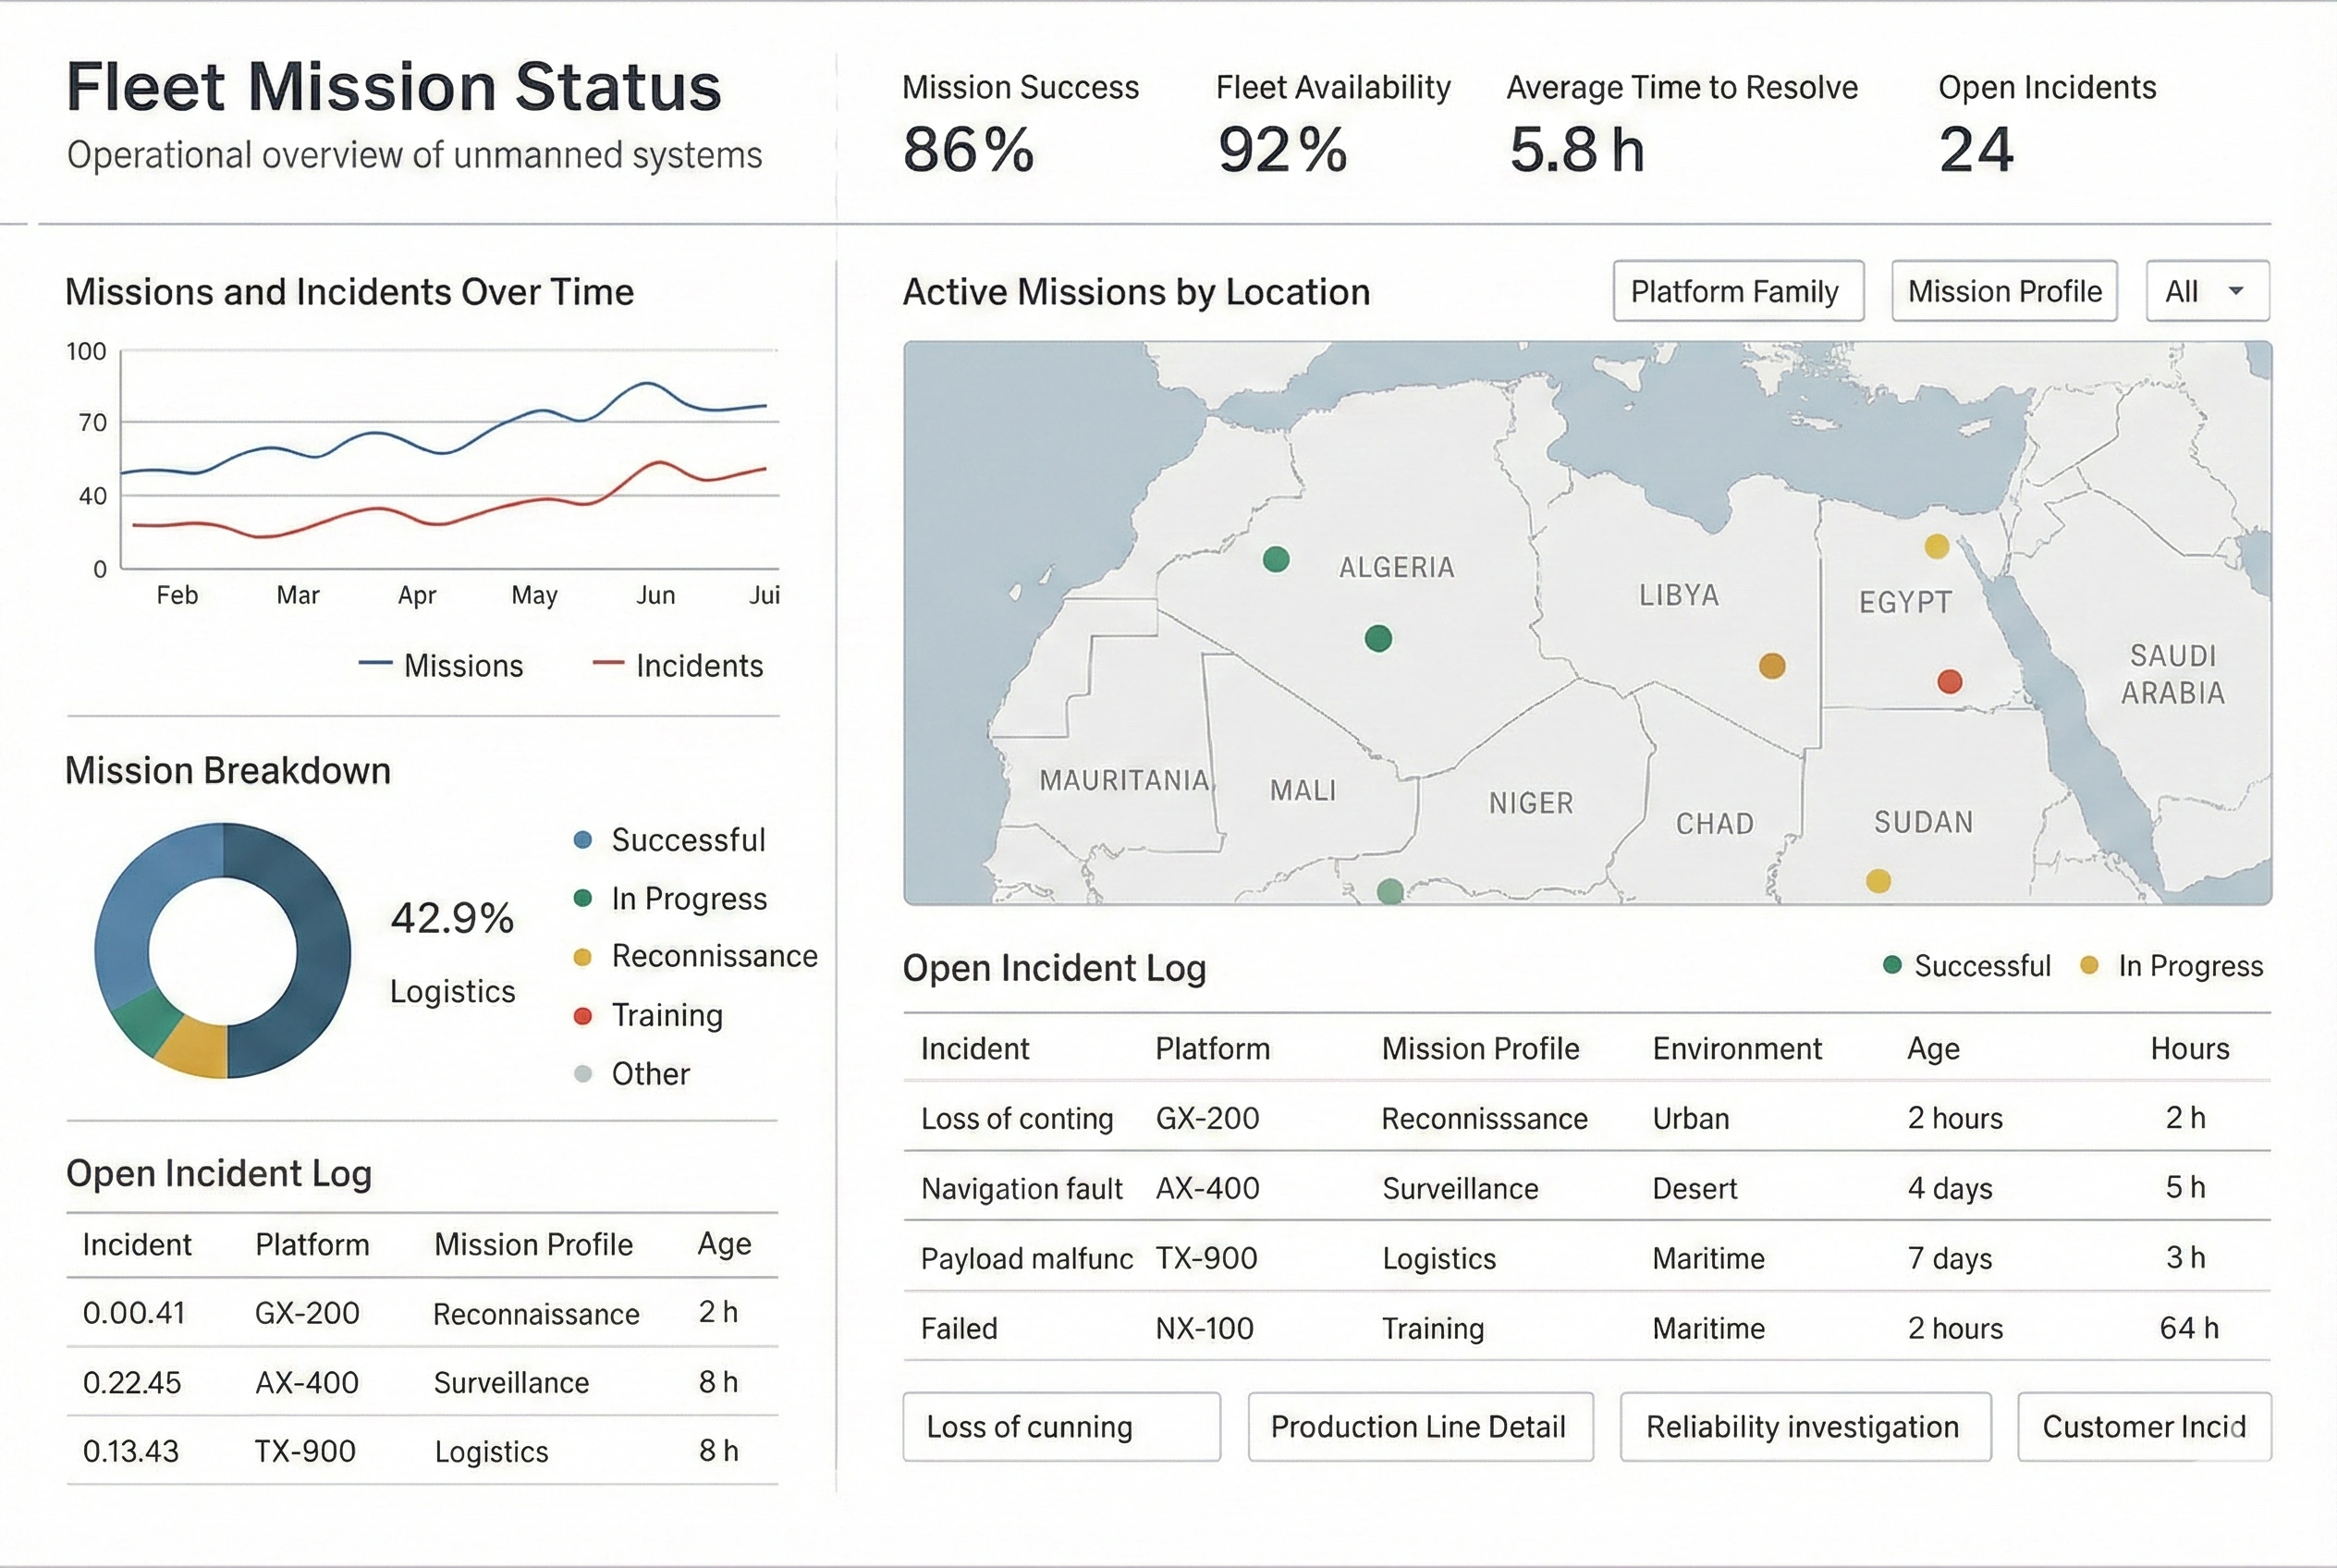
One of the most valuable use cases was closed loop reliability analytics. The manufacturer wanted to understand how design choices and production conditions affected field performance of unmanned systems. Using InetSoft they created a mashup that linked design configuration, test results, production batch data, and field failure records.
Engineers could now see which combinations of components and suppliers correlated with higher failure rates in specific environments. They could filter by mission profile, operating temperature, or payload configuration and immediately see the impact on reliability. This insight guided design revisions and supplier qualification decisions which reduced warranty costs and improved mission readiness for customers.
Production and supply chain optimization
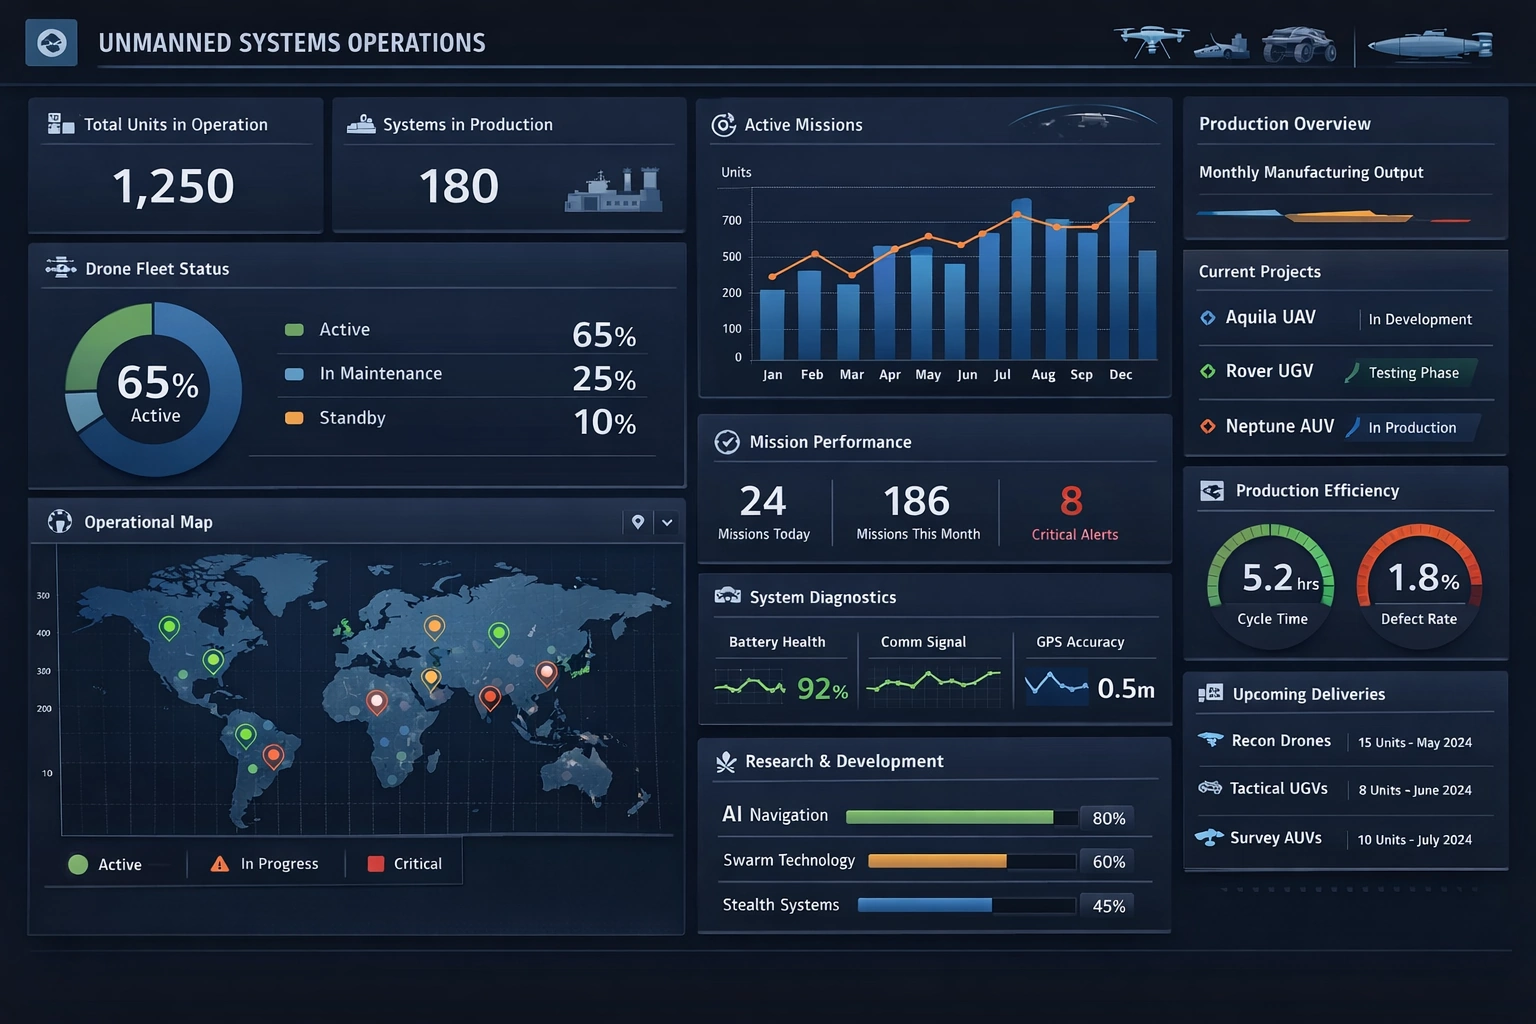
The operations team used the mashup engine to combine ERP data, manufacturing execution metrics, and supplier performance indicators. They built a semantic view that tracked each unmanned system from order entry through final assembly and shipment. This view included lead times, rework events, and quality inspection results.
With this unified model planners could identify bottlenecks and high risk components. For example they discovered that a specific sensor supplier had variable lead times that caused schedule slips for a key platform. By visualizing this pattern in InetSoft dashboards they justified a dual sourcing strategy and redesigned safety stock policies. The mashup engine made it possible to refresh this analysis daily without manual data wrangling.
Service analytics and customer experience
Service and support teams used InetSoft to connect CRM, ticketing, and telemetry data. They created a Customer Health view that showed each fleet of unmanned systems along with open issues, recent failures, and usage patterns. This view allowed account managers to anticipate problems and schedule proactive maintenance visits.
When a customer reported an issue support engineers could pull up a dashboard that combined recent telemetry, configuration history, and similar incidents across the fleet. This reduced troubleshooting time and improved first time fix rates. Over time the company used this data to refine maintenance schedules and update training materials for operators.

Governed self service for technical and business users
A major advantage of InetSoft for this manufacturer was the balance between governance and self service. Central data architects defined core mashups and semantic views. These objects enforced consistent definitions for metrics such as mean time between failure, on time delivery, and defect density. At the same time power users in engineering and operations could extend these views with their own calculated fields and filters without breaking the underlying model.
Because the mashup engine operated through a web based interface there was no need to distribute desktop modeling tools. New users could be onboarded quickly and could start exploring data using curated views. This reduced the backlog of custom report requests and allowed the analytics team to focus on higher value modeling work.
Results for the unmanned systems manufacturer
Within the first year of using InetSoft the manufacturer reported several concrete benefits. Time to produce cross functional analyses dropped from weeks to hours. Reliability improvements driven by mashup based insights reduced warranty claims and improved customer satisfaction scores. Operations teams used the unified data model to shorten lead times and reduce inventory for critical components.
Perhaps most importantly the organization developed a shared language around data. Engineers, planners, and account managers all worked from the same semantic views and dashboards. This alignment supported faster decision making and more confident commitments to defense and commercial customers who rely on unmanned and autonomous systems for critical missions.
The InetSoft Data Mashup engine became the backbone of enterprise analytics for the manufacturer. It connected diverse systems, preserved local detail, and presented a coherent view of performance across the product lifecycle. For a company whose products operate autonomously in the field this level of analytical integration created a strong competitive advantage.
![]()
More Articles About Data Mashups and Their Applications
ActiveCampaign Dashboards - Searching for the best dashboard for your ActiveCampaign data? ActiveCampaign is a cloud software platform for small-to-mid-sized business that combines marketing automation with traditional CRM. InetSoft's StyleBI includes a custom web connector for integrating your ActiveCampaign data. In order to increase revenue, a company must foster effective marketing strategies based on the CRM reports and end initiatives that are performing poorly. However, in order to do that it is critical to have an application implemented that allows for the easy understanding and interpretation of the CRM data...
Adding Contextual Information to Your Data Visualization Tool - That’s kind of interesting. So I can see how visualization could be very useful in systems management if you’re trying to understand how very complex systems are performing or not performing. I am guessing that's a pretty key area for data visualization. We’ve all seen these kinds of systems management software. We see peaks in valleys and you can see kind of how their operations are running. What are some other interesting ways to visualize that stuff and get a better handle on things? Dale Skeen: Well, I can give you an example. TXU is the largest retail energy provider in Texas. They want to visualize their customers’ transaction through their systems such as customers enrolling, reconnecting, disconnecting, or moving from one service provider to another one. This is all automated in multiple systems so they can monitor just the lowest level of detail such as an action that took place on the SAP system. It doesn’t convey insight as to how well these processes are progressing, if problems are occurring, if the customers have been affected. With our tool we were able to add contextual information -- the right context and the right visibility into what’s going on. The context we’re following is first used as a process discovery tool. Then, it visualizes how these actions are laid out sequentially thoroughly over time. And then just over several iterations you can discover what the underline accepted progress of a transaction should be. That becomes a process now. And then as you start tracking the raw information and then present it in the context of this process, there is a process diagram...
Advent of Big Data - Companies have been analyzing data for years. That’s not new. Before we get too far into this topic, let’s set the stage for this topic. Let’s explain what has changed. What does ‘big data’ mean? It’s actually a difficult area to define. It’s actually a little bit like cloud computing. Any discussion of cloud usually spends the first 45 minutes arguing what everyone means by it. I am going to try to avoid that when we’re talking about big data. Companies have had big databases for years, and some of them are very, very large. One of the things that can be implied by big data is that the database has become so large that it is no longer easily dealt with, managed, reported on, or analyzed with traditional database tools. That’s only part of the problem though. One of the other parts is sometimes traditional database tools can look at a really large data set, but they can’t do it particularly fast. So maybe if you want to look at a smaller data set, but get the data in real time, that would be another instance where you might want to use the new big data tools...
Advice on Data Mashups - That’s a very good point. William, what Malcolm has just been talking about is very interesting, this source data analysis stuff, I wonder, you know we had a show a couple of weeks ago on data profiling and the importance of data profiling, I wonder if mashups can be used in that whole process. Especially when you have these very large organizations that have so many data sources. It can be a real mess trying to sort them out. And as Malcolm just said, sometimes you sort them out, and then they forgot, and you have to sort them out again. Is there a role for mashups in that very process of source analysis and understanding even what is out there? If there is, one of the vendors could speak to that more. I don’t see it. I see a perpetual cycle, continuing cycle of rolling up your sleeves, getting your hands dirty, and discovering. Business changes so quickly through mergers and acquisitions, through regulatory compliance, the speed of business is too quick. So I don’t see the silver bullet approach for getting your hands dirty. Where I am at now, we still have people going through COBOL copy books that are twenty-five years old, asking what does it all mean to really figure out the ontology of the data...
AgKnowledge Case Study - AgKnowledge is an industry leading, cloud based Agribusiness SaaS solution for medium and small fresh fruit and vegetable producers and distributers. The AgKnowledge user portal utilizes InetSoft's StyleBI to deliver dashboards and reports, and to provide data models which save time, as they can be reused for different clients...

Alphabet Soup of Data Integration Technologies - Today we are going to talk about data integration, and attempt to sort out the alphabet soup of data integration technologies. We’ll learn the differences between ETL, EAI, EII, EIM, and explain how things like SOA help data integration. We’ll provide some insight into why companies choose one method of data integration over another? While some terms like ETL or Extract, Transform and Load have been around for a while, other terms like EII, or Enterprise Information Integration, are fairly new. Even when you know what the abbreviation stands for, it doesn’t always shed much light onto what they do and how and why people choose different integration technologies. We are talking about data integration, and I think that most people know it will be great to have all their data sources highly integrated. What is really forcing companies to take data integration seriously? There are a lot of business drivers now for companies to do data integration. Suddenly there are government regulations such as Sarbanes-Oxley which is putting a lot of pressure on the financial transparency demands and stockholders. There are industry regulations and initiatives across other industries such as HIPAA and Basel II Accord...
Alternative to Data Warehousing - Data warehouses are typically used for reporting and and data analysis. They are central vaults for large amounts of data, created by gathering data from several other sources. Data warehouses store both past and present data which is later used for reporting and forecasting purposes. The conventional process for using this data is ETL; extract, transform, load...

Alternative to Kyvos - When you are evaluating modern analytics platforms, it is easy to get lost in buzzwords like “semantic layer,” “AI-powered analytics,” and “cloud-scale OLAP.” Kyvos positions itself as a semantic layer for AI and BI, focused on delivering a unified view of enterprise data and fast analytics at scale. InetSoft, by contrast, is a mature, full-stack business intelligence and reporting platform that combines visual analytics, interactive dashboards, and pixel-perfect reporting in a single, cohesive solution. InetSoft If you are looking for a practical, flexible, and cost-effective alternative to Kyvos, InetSoft deserves serious consideration. Kyvos is excellent at being a semantic layer: it standardizes metrics, definitions, and business logic so that multiple BI tools can consume governed data consistently. However, that also means you still need separate tools for dashboarding, reporting, and visualization, plus the integration work to connect them all...
Alternative to Metabase, A Comparison to InetSoft - Metabase offers an attractive looking visual SQL query building tool to serve ad hoc reporting and charting needs. InetSoft offers a completely customizable data visualization, analytics, dashboarding and reporting platform with a very strong data mashup and transformation engine. Maturity of Code InetSoft has 21 years of experience in business intelligence and reporting software development with sole control over source code. Metabase is a startup founded 3 years ago relying on the best efforts, open source model of code development. Company Resources InetSoft employee count is over 150. Metabase is under 10. InetSoft is profitable, self-funded, requiring no venture investment and control. Metabase is venture-backed with inherent uncertainty of future success or viability...
Analytical MDM Platforms - New releases in the technology have advanced it to be a true enabling operational and analytical MDM platform. I think that the state of the technology is there are a lot of vendors in the marketplace who initially went out with an application to try to solve a specific niche problem. Those were the ones who have a CDI product, or the ones that have a PIM specific product. They are realizing that the market is evolving where cross-domain data management is what people want. They want to start with CDI and then move to a product or move to a supplier, etc., etc. So the platforms now need to be able to support those cross domains. And the reality is in most MDM implementations, it's not like I am going to bring an application, and immediately it’s in place, and it's up and running. Because of the nature of the business rules and business processes associated with any MDM implementation, there is a customization that’s needed within that framework. So the platforms really need to be flexible to map to those specific business processes or business rules that that company needs. I think that within the market, there is some confusion about should I have a master hub or should I have the federated type, what you call a registry style, etc. Vendors who provide databases and a data platform, of course, believe you need to actually have that data in a place centrally located, etc...

Analytics Have Moved Beyond The Data Warehouse - Okay, move onto the next topic here. I think we have moved to a point where analytics have moved beyond the data warehouse. A data warehouse is obviously a good repository for certain types of functions within the organization. When we start talking about sound data of when we're talking customers calling in and the recordings of those customers and for trying to do sentiment analysis on those or categorizing calls or trying to analyze certain calls from the wider body of calls to find out what worked, what didn't work. If we talk about transactional data, and we're not just talking about storing transactions for operational purpose, we're really trying to detect anomalies in those transactions, so we can â€" if there's something really wrong happening here -that we can interfere with those. Sometimes it takes a little bit more than just the simple business rule to determine whether an individual transaction is fraudulent, for example, or is going against policies or whatever. We talk about sensor data and the whole Internet of things, and this is another really big hype another one. We could talk about for an hour on this. What data should those sensors be collecting? We talk about oil rig maintenance and trying to determine when is the right time to schedule a maintenance appointment for those oil rigs. Shutting down those rigs is big money and doing it at the right time so that it's not inefficient or costly is key. Doing it too early means you're actually wasting money, and I hate using that as an example because I would much rather that we could find another way to get around than using oil...

Analyzing Streaming Data - This ties into what we talked about in terms of deploying these models in production in real time. The earlier points we've made about automation which I think apply in a typical organization even actually the leading edge Bay Area start up internet companies, but there's this distinction between software engineers and data scientists. What is this distinction? Software engineers tend to be very good at writing code. They're very disciplined. Their code is very nice. It scales. It's easy to maintain. Data scientists are very good at the analysis of data and making sense of data. Usually when a data scientist does an analysis and builds a model they end up having to hand over their model to a software engineer who then rewrites it into the production environment, according to the standards of the production environment. On the other hand to the extent that a software engineer can do what a data scientist can do, because obviously there are these easy to use machine learning libraries that they can use for themselves. It's possible that they do some of that, but I think if you talk to many people who work with data they will tell you that â€" for many software engineers their strength is really in actually writing something that's been well specified and spec'ed out. With data scientists, their strength is in the data discovery and learning what the right model to use. Whenever there's a little bit of ambiguity around the project then it becomes harder for a software engineer to actually do something that replicates what a data scientist can bring to the table...
Another Data Quality Tool - The last thing that people want to do is buy another data quality tool. That’s been an inhibitor. People want to buy a new MDM solution that’s been built ground up to support MDM. I have got a lot of the existing components because I have built data warehouses. Can I reuse those or do I have to scrap those and invest in who new technology? Well that’s a tough call for lot of these folks. But I will say there is one technology component we haven’t mentioned yet that everyone has overlooked, the early adopters anyway, and I think it's because the product didn’t exist a couple of years ago. That’s cross-source data profiling. There are now tools to cut through that, and that’s a huge pain point, took lot of money, a lot of time. We now have tools to automate that. Data profiling is identifying the relationship between tables and systems. In some respects what you want is an MDM framework or architecture that allows you to bring in, if you have already got a data profiling tool, fine, bring it in and plug it in. If you don’t have one, then maybe you want to buy one or something like that. It allows you to use the existing technology which you already have, ETL tools, data profiling, data quality, on and on and on it goes. Can I plug them into these various places and use them within my master data management framework and not have to buy yet another set of technologies that duplicates whatever you have...
Answer Is Data Mashup - So this shift to commodity super computing drives a change from traditional BI where you had upfront data modeling that then results in a company’s relatively slow response time to change in the outside world, to more of a model-as-you-go approach which then allows a fast response to change. We will talk about what that means with a particular story. These new market requirements demand a new approach, and of course we have a particular way to address these new requirements. For this new requirement of data and content from any type, format or source and bringing that all together, our answer data mashup. It’s the data access engine at the heart of out platform. For this second requirement of interactive applications for business users, our response to that is providing a toolset to build highly interactive BI applications in HTML5. This enables data exploration, ad hoc information access and data discovery. Our BI technology is not only used for decision making among employees but it is also used for improving consumer decisions. We know that this approach works, and we are now bringing those innovations to the enterprise so that decision making can be improved...
Answer Is Data Mashup - So this shift to commodity super computing drives a change from traditional BI where you had upfront data modeling that then results in a company’s relatively slow response time to change in the outside world, to more of a model-as-you-go approach which then allows a fast response to change. We will talk about what that means with a particular story. These new market requirements demand a new approach, and of course we have a particular way to address these new requirements. For this new requirement of data and content from any type, format or source and bringing that all together, our answer data mashup. It’s the data access engine at the heart of out platform. For this second requirement of interactive applications for business users, our response to that is providing a toolset to build highly interactive BI applications in HTML5. This enables data exploration, ad hoc information access and data discovery. Our BI technology is not only used for decision making among employees but it is also used for improving consumer decisions. We know that this approach works, and we are now bringing those innovations to the enterprise so that decision making can be improved...
Apache Cassandra Dashboard Software -InetSoft's very first product offering was a reporting tool that made SQL database analysis easier than traditional methods. Since then, InetSoft has expanded it's solution to include robust data mashup, intuitive visual dashboarding, and scheduled automated reporting. InetSoft's flagship product, StyleBI, can connect to Apache Cassandra for the easy creation of reports and dashboards. But it's reporting capabilities do not stop there...
Apache Spark Dashboard Software - Do you need help connecting to and blending your Apache Spark data? Apache Spark is an open-source unified analytics engine for large-scale data processing. InetSoft's software can connect to Spark and other Big Data sources from anywhere, making it easier to manipulate data because it's all in one place...
Applying Machine Learning to Improve Customer Service - Now let's move on to the next topic in applying machine learning to improve customer service. Twenty percent of companies are already utilizing virtual digital assistants. They interact with employees and with customers in a fast paced manner. If you look to the future, more than two thirds of the organizations are considering implementing such digital assistants over the course of the next two to three years. I'm going to share one example as well which is support ticket specification. If you look at the common customer service issues and you have a lot of tickets coming in and these issues contain common keywords like bill or payment. They appear often in the support ticket category. If we look to machine learning, they could learn the distinction between these words and between categories, and they can identify the regular patterns. They can support agents to use their application to automatically categorize tickets and provide a first suggestion so this speeds up the whole process of support. The algorithms give this suggestion for a level of accuracy, and then the machine learning algorithm directly adds words to tickets based on the predictive category for the next agent, and this speeds up this whole support process. This is an area where we're going to see rapid improvement just like the improvement in cars. It started with no automation and then maybe you had a cruise control and maybe road lane assist and maybe an adaptive cruise control and maybe a navigation system and soon you're on your way to self-diving vehicles...
Are Data Warehouses Still Necessary? - The Value of Data Warehouses: Data warehouses serve several vital functions that make them an essential component in many organizations: Data Integration and Consolidation: They are designed to aggregate data from various sources, transforming it into a consistent format. This is particularly crucial in organizations with diverse data sets from different departments or systems. Performance and Query Optimization: Data warehouses are optimized for complex queries and analytics. They use techniques like indexing and data partitioning to ensure that even with large datasets, queries can be processed efficiently. Historical Data Storage: Data warehouses often store historical data, allowing organizations to analyze trends and patterns over time. This is essential for making informed decisions based on past performance. Scalability: They are designed to handle large volumes of data and can scale horizontally to accommodate growing data needs. Data Security and Governance: Data warehouses are equipped with features for access control, encryption, and compliance with data protection regulations. This ensures that sensitive information is handled securely. Challenges and Alternatives: Despite their advantages, data warehouses do face some challenges...
Basic Rules in Creating Data Visualization - I guess I'll bring you back in. What are some other basic rules or tenets that you've seen espoused or used effectively with respect to data visualization? Anything that comes to just the top of your head...

Before You Start a Machine Learning Project - I think it's just really important to think about before you start a machine learning project or an analytics project, how are you going to tell if this is making sense, if you're saving money, if you're creating revenue, if you're finding knowledge? Before you get involved with one of these projects you need to think about how you're going to assess it. That varies a lot by different businesses but being able to have a feedback loop where you can tell how well your machine learning project did, you need to think about that from the beginning. How am I going to work that into my machine learning solution? What are my assessment criteria going to be? Am I trying to create revenue? Am I trying to find savings? Am I trying to generate knowledge? Just be aware of that, it's a hugely important part of the process, but we're running out of time and we're just going to go to questions. All right so we have time for one to two questions. Let's lead off this one: do you have any practical examples in the area of manufacturing? Yes, but unfortunately I can't talk that much in detail about it for confidentiality reasons since this is a real customer use case. We work with a large manufacture of high tech devices that are used in computers and cell phones. It's an older company. They have their manufacturing process nailed down just perfectly, but they want to keep pushing that. They want to keep improving them...
Benefit of Integrated Data Preparation - Let's talk about the benefit of integrated data preparation, certainly, I've talked a lot about that in different webinars. Now we're seeing the whole field data preparation and data pipelines, what it takes from the process of collecting the data to transforming it and really preparing it properly so the users can work with it. We are seeing this starting to tighten up integration with BI and analytics systems as in our platform. This is important again to support self-service and help users get moving faster. Backing out a little bit, let's talk about the priority issues in this process of democratization and moving out to different kinds of nontechnical users and embedding things into their business applications and business processes. The three big things really are context, I mentioned a minute ago, in context recommendations. Well context really across the board is very important as you move into business processes because this is no longer a standalone decision support system. We're talking about how can we personalize insights to ensure their relevance to make sure the insights are actionable? Autonomy is very important. Make data discovery easier for users. I mentioned again before that they're seeing automation and embedded analytics functionality aimed at this to actually make the self-service BI experience better, so that users can do more in a self-service way...
Best Data Visualization Tool for Monitoring Usage - Yeah cool. Okay, folks, back here at DM Radio talking all about data visualization and, hey, the bottom line is what works is what you should use. That's what you should go with...
Best New Data Pipeline Tool - Traditional ETL and data pipeline tools were designed for a world where data lived mostly in a few on-premises databases and the primary goal was to load nightly batches into a warehouse. That world is gone. Today, teams are dealing with SaaS applications, event streams, semi-structured files, APIs, data lakes, and multiple cloud platforms—often all at once. Legacy tools, even when rebranded as “modern,” still carry assumptions that make them brittle in this environment. One major shortcoming is rigidity. Classic ETL tools tend to encode business logic deep inside complex, visual flows or proprietary scripting languages. Pipelines become hard to read, hard to test, and even harder to refactor. When a new data source appears or a schema changes, engineers must untangle a web of transformations just to keep things running. This rigidity slows down experimentation and makes it nearly impossible for analysts or domain experts to safely participate in shaping data flows. Another issue is their batch-first mindset. Many older platforms were built around nightly or hourly jobs. While some have added streaming or micro-batch capabilities, these are often bolted on rather than native. As a result, organizations that need near–real-time analytics or operational dashboards end up stitching together multiple tools—one for streaming, one for batch, one for orchestration—creating a fragile, hard-to-observe ecosystem. ..
Best Practices for Applying Analytics to Big Data - That is definitely a best practice for applying analytics to big data. Assess your maturity, and start from where you are and build from there. Another best practice is to really look at the signals. Understand not just the structured data that we’ve traditionally looked at with business intelligence, but what are the new signals that are coming from click stream data, RFID tags, asset intelligence like with the windmills. What issocial media saying about my products and my reputation? What’s my workforce’s opinion through the wisdom of crowds? So lookat all of the signals when I ask that soft question and make sure that we are taking all of the views into when making decisions. Another interesting thing about it is that it really has a very strong focus on the decision to be made and the decision maker. And that idea of start where you are is very key. I was talking recently to a marketer who asked me about focus groups, does that count as analytics? And I said, well, on the one hand, focus groups have largely been discredited. There’s a well-known tendency for participants to tell you what you want to hear...
Best Practices in Data Mining - When you talk about best practices in data mining, what are some of the first things that you tell people to keep in mind? Flaherty: What I really try to stress is to think about the data. Actually spend some time trying to understand it, trying to go beyond what you can get just out of the box using some analytical software. It seems like there is so much capability there that sometimes, we are tempted to turn our brains off when we get close to a data set. Moderator: Right. So you really have to kind of think about the data and the context of the data. You really have to focus on what is the goal that you have in mind, right? Flaherty: Absolutely, you need to really start at it from both ends like you said, the goal of where you want to get to. Think about where you are starting from. What is the population of data I am working with? Is it my customers? Am I thinking about sites for retail locations? Am I thinking about production jobs that I am trying to run out of manufacturing plant? All of those things might be my population or the level of analysis that I am trying to do. And you really have to put that into the proper context. I always find myself asking, “compared to what.” Now if I look at a set of customers, you think okay well, I have got a lot of one gender, for instance. Well, how do I know that? Compared to what...

Best Practices in Data Warehousing - We have some really excellent best practices in data warehousing, and we carefully study to be sure we find just the right sources. Be very careful with data transformations to make sure that we are not losing any value from the data as we transform it. We make models that are really going to be useful. With those models we really want to have hefty metadata management. Nowadays there is master data management and other things that help us to document and beef up the semantics around data. I could go on and on. You have heard this before. This is sacrosanct stuff. And you start contradicting these careful steps, there are people who push back and say no, no, no wait, I have built my career on this rather slow moving but high quality process. So you ask, ‘how do we speed it up the data delivery process without losing the quality of data, without losing the intelligence of models and so on and so forth’ That’s one of the really hard parts. In so much of the work we do in BI or data warehousing, the data modeling has been front-loaded. We have got this planning process, the requirements gathering, and across the board I am seeing a lot of people just pushing real fast to get to some kind of prototype. And once you get to the prototype that’s when the iterations kick in. That’s when things we associate with agile kick in...
Best Practices in Using Data Visualization - Yeah, that makes sense to me. And Dale, any best practices that you'd want to share? eah, that makes sense to me. And Dale, any best practices that you’d want to share? Dale Skeen: I would just like to emphasize on a comment that Wayne made, which I think is very important. Wayne said the best presentations are really layered delivery system and I think that cannot be over emphasized. More to that, they also invite user exploration. They are set up to allow users to navigate that in flexible ways. And they can do things like zooming and panning so you can see the level of detail. Also, they can filter out outliers so that you can understand better what the data is. So I think that type of really designing these dashboards or these presentations of data to support this type of user exploration is extremely critical. Eric Kavanagh: Yeah. That makes a lot of sense to me and, Robin, I’ll throw it back over to you. Any good ideas you’ve got in terms of best practices or things to avoid? Dr. Robin Bloor: Well, Wayne has it in terms of principles. It is definitely important how useful the dashboard is, how accessible is that, how can you get from the presentation of that data as it’s done to the details. But, you know there is completely different context and, for info-graphics, it’s just a matter of being honest with the way the data looks. I am not trying to blow it up, which is the common behavior pattern of the marketing world -- different feel to people actually investigating data and going into. And all this really has to do with is the context but what is the user expecting to see...
Best Web Dashboard Software for Effective Data Management - Key Highlights Dashboard software transforms complex data into clear, visual insights to help you make smarter and faster decisions for your business. Effective tools offer powerful data visualization and business intelligence features to track key metrics in one central location. Effective tools offer powerful data visualization and business intelligence features to track key metrics in one central location. Leading analytics platform options allow you to connect multiple data sources, giving you a complete view of performance. Look for software with customizable dashboards and templates to tailor the view to your specific team's needs. Real-time updates ensure you have the most current information for accurate monitoring and reporting. Are you tired of sifting through endless spreadsheets to understand your business performance? Web dashboard software is the solution. These tools pull information from all your different data sources into a single, easy-to-understand visual display. By using powerful data visualization and analytics, you get a real-time snapshot of what's happening in your business. This allows you and your team to spot trends, track progress toward goals, and make informed decisions without getting lost in the numbers...