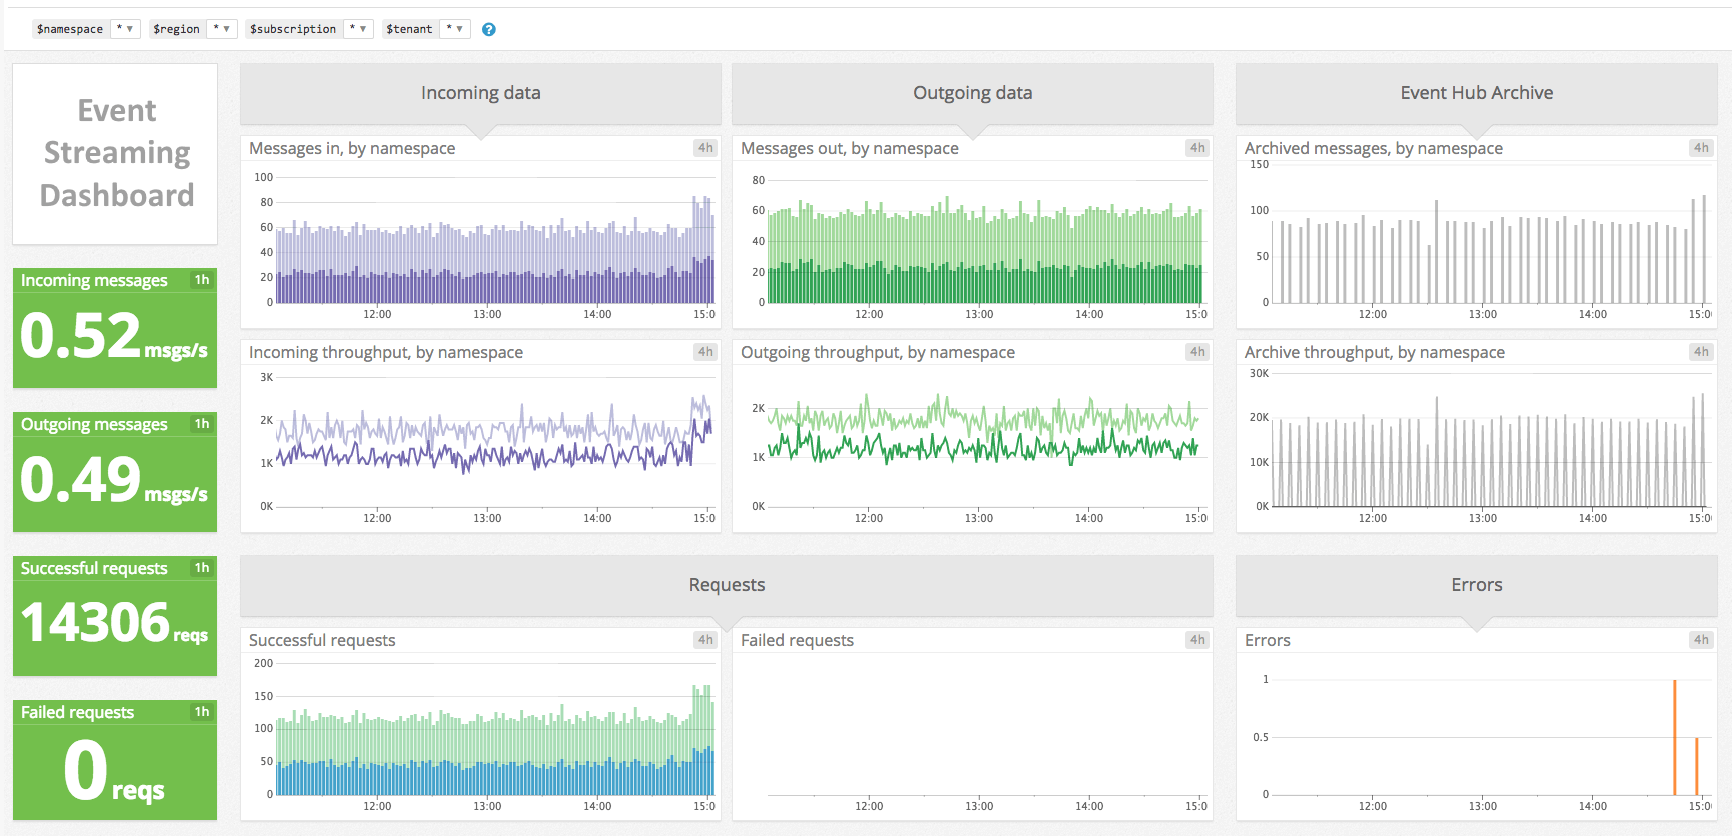
Evaluate InetSoft's Keen Event Streaming Dashboard Solution
Looking for a good dashboard solution for Keen event streaming? InetSoft's pioneering dashboard platform can mashup your streaming data with other enterprise sources. Make great-looking cloud-based dashboards with an easy-to-use drag-and-drop designer. View a demo and try interactive examples.

Register for more information and a personalized demo
About InetSoft
Since 1996 InetSoft has been delivering easy, agile, and robust business intelligence software that makes it possible for organizations and solution providers of all sizes to deploy or embed full-featured business intelligence solutions. Application highlights include visually-compelling and interactive dashboards that ensure greater end-user adoption plus pixel-perfect report generation, scheduling, and bursting. InetSoft's patent pending Data Block™ technology enables productive reuse of queries and a unique capability for end-user defined data mashup.
This capability combined with efficient information access enabled by InetSoft's visual analysis technologies allows maximum self-service that benefits the average business user, the IT administrator, and the developer. InetSoft was rated #1 in Butler Analytics Business Analytics Yearbook, and InetSoft's BI solutions have been deployed at over 5,000 organizations worldwide, including 25% of Fortune 500 companies, spanning all types of industries.

More Resources and Articles about InetSoft's Keen Event Streaming Dashboard Application
About InetSoft's Visual Dashboards - This is a listing of relevant product information about, and features of, InetSoft's visual dashboard application...
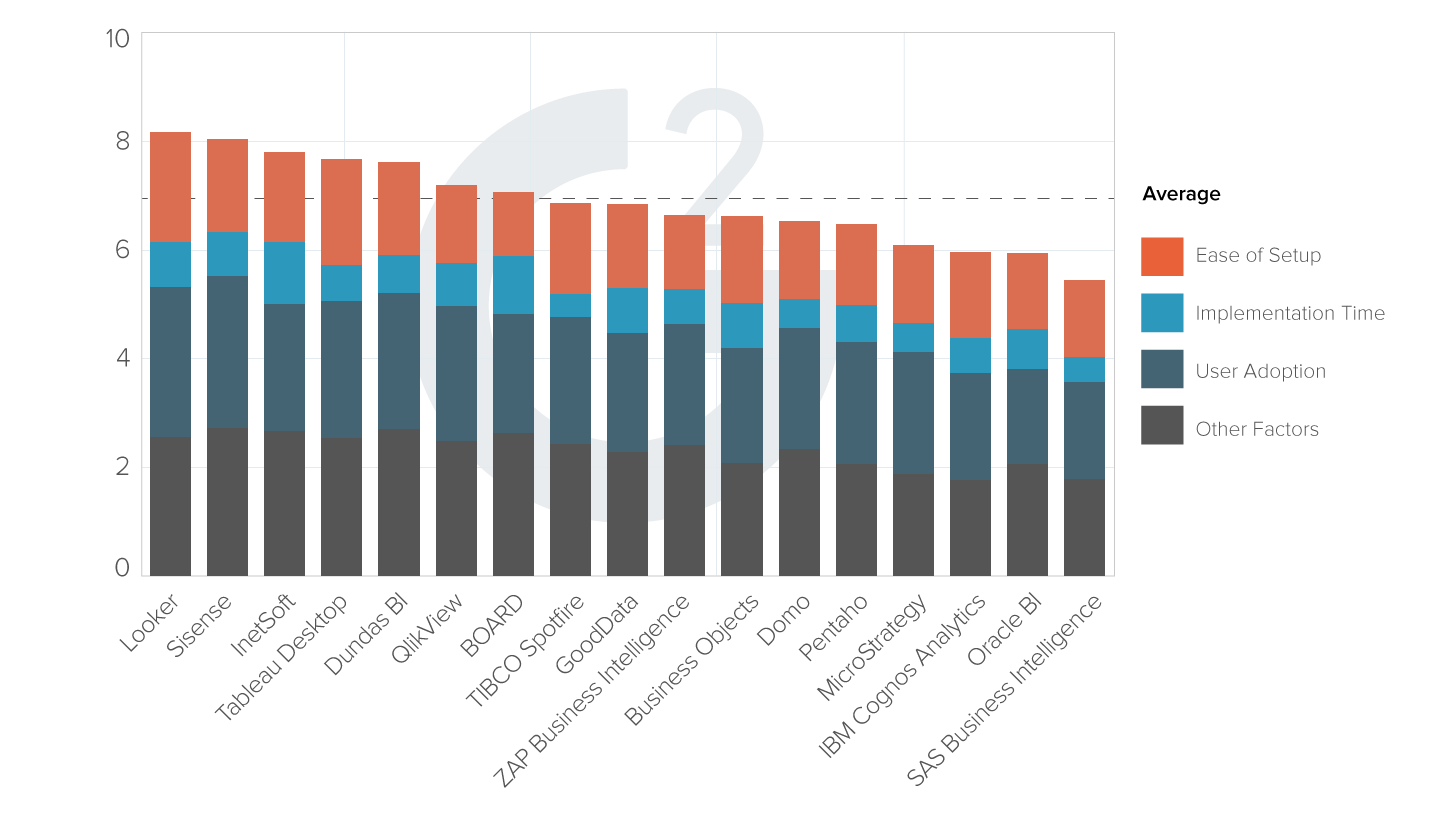
| #1 Ranking: Read how InetSoft was rated #1 for user adoption in G2's user survey-based index | Read More |
Advice for Operational BI Implementations - What are the problems that an organization should be unaware of? Well, the first big problem is that the operational personnel simply won't use it, and the reasons are many there. Perhaps they don't understand it. They were caught off guard by this implementation being dropped more or less in their laps. They may not be educated about how to use it. They are very used to their operational interfaces. And operational business intelligence has a very different kind of interface, so they may not have been trained on how to use it...
Agile BI in Demand - One of the reasons agile BI is more in demand today is in response to increasing data access pressures. Data capture grows exponentially, and business knows there's gold in that data. Data has grown so much, people use a new term to describe it: big data. Big data, itself, has become one of the hottest topics out there: big data. There are lots of reasons why there is so...
Analyzing Real Time Streaming Data - This ties into what we talked about in terms of deploying these models in production in real time. The earlier points we've made about automation which I think apply in a typical organization even actually the leading edge Bay Area start up internet companies, but there's this distinction between software engineers and data scientists. What is this distinction...
Architecture of the New Information System - I often talk about how the architecture of the new system really drives how long the project will take and how complicated the project plan needs to be. If an organization is stitching together a bunch of best of breed systems along with an enterprise data management system, you probably don't want to do too much at once but I would say it's pressed...
 |
View live interactive examples in InetSoft's dashboard and visualization gallery. |
Availability of Mobile BI Solutions - Have you ever found yourself or a colleague unable to make a critical meeting? Is it often difficult to get remote personnel the most recent data? Studies suggest that organizations who give more people access to BI are more effective at reaching corporate goals. And what the industry is seeing now is that organizations using mobile business intelligence are able to deploy BI to roughly twice as those who have not...
BI Application for Corporations - Looking for a good corporate business intelligence application? InetSoft is a pioneer in dashboard reporting, and our platform includes a powerful, flexible data mashup engine for generating complete views of corporate performance. View a demo and try interactive examples...
BI Technologies That Handle Streaming Data - BI technologies that handle batch and streaming real time data often are different technologies from those that handle historical and predictive analysis. Complex data structures really don't work with nice traditional relational or multi-dimensional databases, and therefore we are forced to build multiple data marts or build multiple cubes to make that happen. Last but not least, meta data from our ETL processes for our data warehouse, and from our Business Intelligence and even metadata from our ERP applications is very siloed. That needs to be addressed...
Dashboard Design Principles - So what I'll do next now is I'll open the floor for some questions about dashboard design principles. If there are some questions, you are welcome to type them into the gotowebinar question panel, and I'll try to address them within the remaining time. Okay, so a couple of questions here. I should have probably mentioned at the beginning, will we get the recording of this presentation? Then, the answer is yes. The recording will be available and will be sent out to you, everybody that registered to this webinar in a follow up email in a couple of days...
 |
Read the top 10 reasons for selecting InetSoft as your BI partner. |
Demo of Department BI Dashboards - Looking for department BI dashboards? InetSoft's industry pioneering BI platform can support any department's business intelligence needs. View examples in the showcase, read articles about its capabilities below, and request a personalized demo...
Good GoSquared Dashboard Tool - Looking for a good solution for GoSquared dashboard reporting? InetSoft's pioneering BI application produces great-looking cloud-based dashboards with an easy-to-use drag-and-drop designer. Create comprehensive views of your website, CRM, communications, and all other organizational data with InetSoft's data mashup engine. Watch a demo and try interactive examples...
Google Analytics Data Mashup - InetSoft Technology (www.inetsoft.com), an innovator in data mashup driven dashboard and reporting solutions, announced the availability of new custom data connectors for popular enterprise applications: Google Analytics, Google AdWords, and Microsoft SharePoint. In all three of these cases, business users and IT staff get upgraded dashboard and reporting design tools, and the greatest benefit comes from being able to mash up this data with other enterprise data for a more comprehensive view of performance... Examples of Real Time Performance Monitoring /business/solutions/real_time_performance_monitoring_dashboard_examples/ - Check out these real time performance monitoring dashboard examples to explore InetSoft's latest, powerful, BI and dashboard building software...
Read what InetSoft customers and partners have said about their selection of Style Report as their production reporting tool. |
Evaluate InetSoft's Decision Support System Dashboards - Looking for good decision support system dashboards? InetSoft's pioneering dashboard reporting application produces great-looking web-based dashboards with an easy-to-use drag-and-drop designer. View a demo and try interactive examples...
How to Define Key Metrics - Also known as a key performance indicator, or KPI, a key metric is a statistic which, by its value gives a measure of an organization's or department's overall health and performance. All organizations, from nonprofits to multinational corporations, need to track key metrics in order to have an accurate picture of what is going on. Simply looking at key metrics can give a reading of an organization that would otherwise require sophisticated analysis of large amounts of data...
Live Data Dashboard Software - Looking for live dashboard software? InetSoft is a pioneer in self-service dashboarding and makes it easy to create real-time dashboards with a drag and drop designer. View a demo and try interactive examples...
Scalable Report Engine - InetSoft provides a high-performance, scalable report engine for production reports for ISVs, OEMs, SaaS providers, and enterprises. Lightweight, yet robust, with an extensible Javascript API, InetSoft's report engine has been embedded in hundreds of applications all over the world...
Read what InetSoft customers and partners have said about their selection of Style Scope for their solution for dashboard reporting. |
Simple Dashboard Designer - The key to successful BI strategy is simple dashboard design. When a business or enterprise wants to explode the potential of their data findings they need to implement business intelligence in a way that is at once sophisticated and accessible. This is from where the idea of dashboard originated. And since their inception dashboards have become increasingly capable, but seemingly at the same time, overtly and unusably complex...
Tips for Creating Marketing Dashboards - So I have some bits of advice for creating marketing dashboards today, and I'm just going to share them. Please take them for that they're worth, and choose for what makes sense for your company. The first bit of advice I have is: choose your metrics wisely...
Tips for Department Dashboards - Looking for department dashboard tips and techniques? InetSoft's industry pioneering BI platform can support any department's business intelligence needs. View examples in the showcase, read articles about tips and techniques below, and request a personalized demo...
Upgrade Your Salesforce Reporting Capabilities - The reports that come with Salesforce are great, but there are plenty of things you wish you could do with them that now you can with StyleBI for Salesforce...
 |
Learn how InetSoft's data intelligence technology is central to delivering efficient business intelligence. |
Use of an Online Data Visualizer - With the use of an online data visualizer, you can transform your raw data into visualizations that are not only easy to understand, but also much more efficient for the entire business...
Useful Resources About Business Intelligence Tools - Below you may find useful resources about InetSoft's tools of business intelligence designed to be easy to use and easy to deploy BI tools by enterprises, ISV's, and SaaS providers...
Using a Report Writer App - In the past, using a report writer app to create business reports has been no easy feat. Typically, the application requires relying on IT professionals to deploy and manage the database, leaving the user without a hands-on opportunity to fine tune the report to be exactly what they need...
Visual Tool for Report Creation - The Report Designer was conceived as an easy-to-use visual tool for report creation, as opposed to directly using InetSoft's API to generate a report, which requires the creation of Java programs...


