Evaluate InetSoft's GoSquared Dashboard Tool
Are you looking for a good solution for GoSquared dashboard reporting? InetSoft's pioneering BI application produces great-looking cloud-based dashboards with an easy-to-use drag-and-drop designer. Create comprehensive views of your website, CRM, communications, and all other organizational data with InetSoft's data mashup engine. Watch a demo and try interactive examples.
GoSquared Dashboard
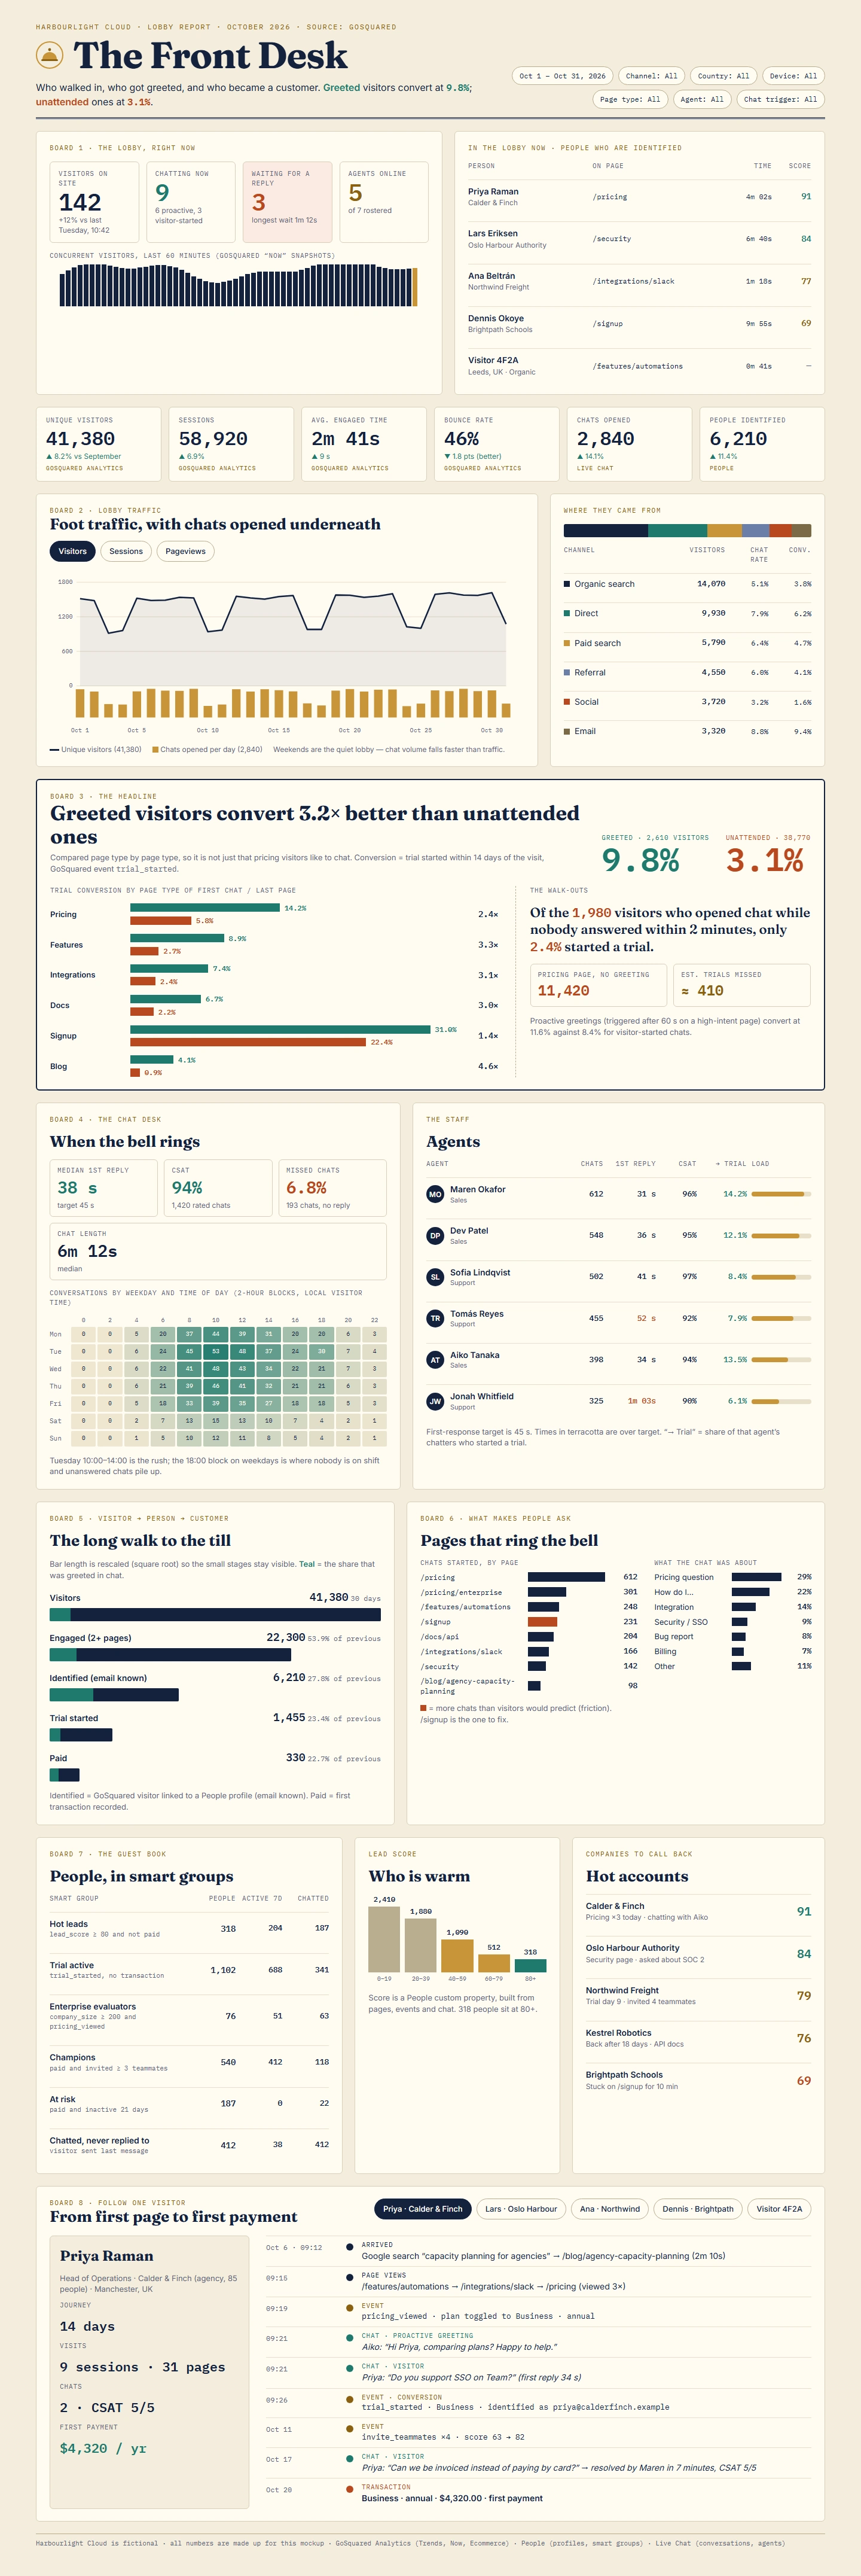
A GoSquared dashboard provides real-time visibility into website visitors, customer interactions, live chat activity, conversion performance, and digital engagement metrics. Designed for marketing, sales, customer success, and revenue teams, GoSquared combines website analytics and conversational intelligence into a single operational view.
The dashboard shown above acts as a digital front desk, helping organizations understand who is visiting the website, which visitors are engaging with chat, what content drives conversions, and how customer conversations influence revenue outcomes.
Dashboard Overview
Unlike traditional web analytics platforms that focus primarily on page views and sessions, a GoSquared dashboard emphasizes visitor engagement and customer interactions in real time. Teams can monitor active visitors, agent performance, conversion activity, and visitor journeys from first website visit through customer acquisition.
This approach allows organizations to identify high-value opportunities while visitors are still actively browsing the website.
Real-Time Visitor Monitoring
One of the most valuable capabilities of a GoSquared dashboard is the ability to view active website visitors as they navigate the site. Teams can see visitor activity as it happens and determine which pages generate the most engagement.
- Current visitors on the site
- Pages being viewed
- Time spent browsing
- Engagement scores
- Identified customer information
- Traffic source attribution
Website Traffic Analytics
Traffic analysis helps organizations understand overall website performance and visitor behavior trends. Interactive charts reveal patterns in visitor volume, browsing activity, and engagement levels throughout the day, week, or month.
Marketing teams frequently use these insights to evaluate campaigns and understand how audience behavior changes over time.
Traffic Source Analysis
The dashboard categorizes visitors by acquisition channel to measure marketing effectiveness and lead quality.
- Organic Search
- Direct Traffic
- Paid Search
- Referral Traffic
- Social Media
- Email Campaigns
Comparing engagement and conversion rates across channels enables organizations to allocate marketing budgets more effectively.

Live Chat Analytics
GoSquared dashboards combine visitor analytics with live chat intelligence, allowing businesses to understand how conversations contribute to conversions and customer satisfaction.
Key chat metrics typically include:
- Chats Opened
- Chat Response Time
- Missed Chats
- Customer Satisfaction (CSAT)
- Conversation Length
- Agent Utilization
- Conversion Rates
Conversion Performance Analysis
The dashboard highlights the impact of customer engagement on business outcomes. Teams can measure how proactive conversations influence lead generation, trial starts, demo requests, purchases, and customer acquisition.
Conversion reporting often reveals that visitors who engage with customer service teams convert at higher rates than visitors who browse without assistance.

Customer Service Agent Performance
Agent scorecards provide visibility into support team effectiveness. Managers can compare performance across agents using operational and customer satisfaction metrics.
- First Response Time
- Conversation Count
- Customer Satisfaction Score
- Resolution Effectiveness
- Trial Conversion Impact
- Agent Workload Distribution
These metrics help organizations maintain high service standards while balancing team workloads.
Customer Journey and Funnel Analysis
Funnel reporting tracks visitors as they progress through important stages of the customer lifecycle. Businesses can measure how many visitors become engaged leads, identified prospects, trial users, and paying customers.
Understanding where visitors abandon the funnel allows organizations to optimize website experiences and improve conversion performance.
Visitor Segmentation
Advanced dashboards categorize visitors into meaningful groups based on activity levels, engagement behavior, and conversion readiness.
- Highly Engaged Visitors
- Trial Users
- Enterprise Prospects
- Returning Visitors
- Inactive Accounts
- High-Priority Opportunities
Segmentation enables customer-facing teams to focus on visitors with the highest revenue potential.
Lead Scoring and Opportunity Identification
Visitor activity data can be transformed into lead scores that highlight accounts requiring immediate attention. Organizations can identify which prospects are showing strong buying signals based on page views, return visits, and chat engagement.
Sales teams use this intelligence to prioritize outreach activities and improve conversion efficiency.

Customer Timeline Analytics
A customer timeline provides a complete view of interactions from the first visit through purchase. Teams can review page views, chat conversations, trial activations, product evaluations, and conversion events within a single journey record.
These insights help organizations understand how customers make purchasing decisions and identify the activities that most frequently lead to successful outcomes.
Building a GoSquared Dashboard with StyleBI
Organizations that require deeper analytics can combine GoSquared data with CRM, marketing automation, sales, customer support, and operational systems using StyleBI. This creates a unified analytics environment that connects website engagement metrics directly to business outcomes.
Decision-makers can analyze traffic, lead generation, sales pipeline performance, customer acquisition costs, retention metrics, and revenue growth from a single interactive dashboard.

Benefits of a GoSquared Dashboard
- Real-time website visitor visibility
- Integrated chat and analytics reporting
- Improved lead qualification
- Enhanced customer engagement
- Better conversion optimization
- Stronger customer service measurement
- Faster sales opportunity identification
- Improved marketing attribution analysis
- End-to-end customer journey visibility
Make More Informed Growth Decisions
A GoSquared dashboard helps organizations connect visitor activity, customer conversations, engagement patterns, and conversion outcomes into a comprehensive real-time analytics platform. By combining website intelligence with live chat and customer journey tracking, businesses can improve engagement, increase conversion rates, and make more informed growth decisions.