How to Compare Dashboards and Comparative Analysis Dashboards
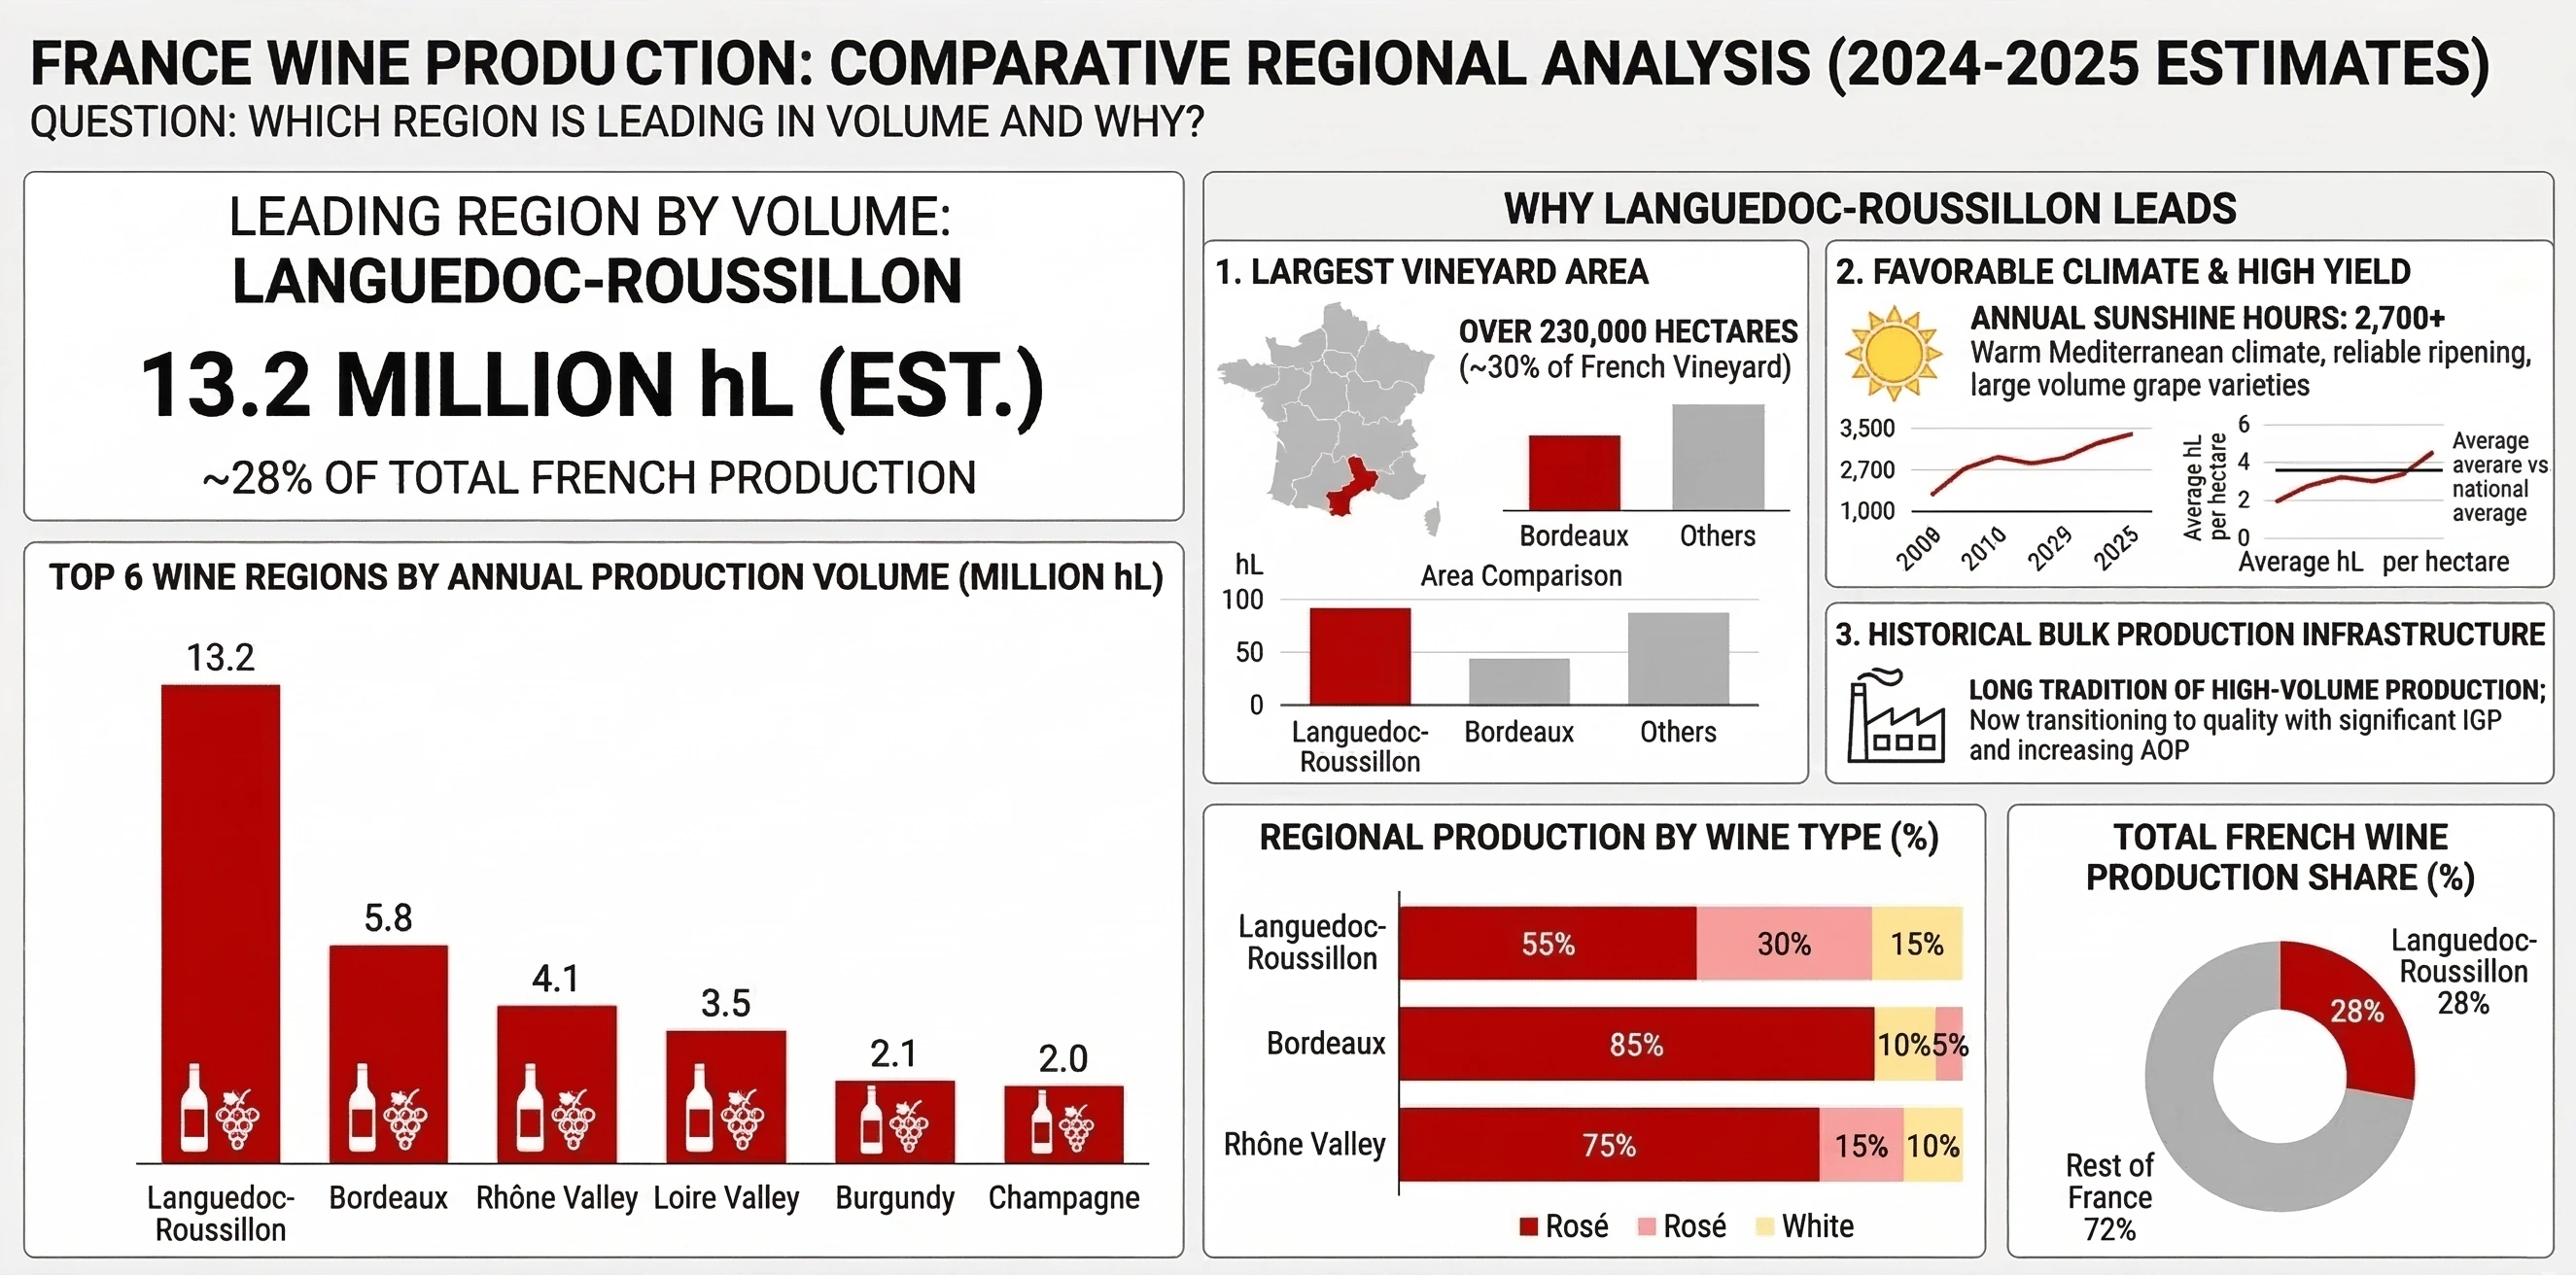
A comparative analysis dashboard is a visual workspace designed to compare multiple entities, time periods, or scenarios side by side. Instead of looking at one metric or one group in isolation, this type of dashboard highlights differences, similarities, and trends across categories. It is especially useful when you need to answer questions like “Which product line is performing best?”, “How does this year compare to last year?”, or “Which region is lagging behind the others and why?”.
At its core, a comparative analysis dashboard brings together structured data, clear visualizations, and consistent metrics so that comparisons are fair and meaningful. It typically includes charts, tables, and key performance indicators (KPIs) that share the same definitions and time frames. This consistency allows users to focus on interpretation rather than wrestling with conflicting numbers or unclear filters.
Common use cases span many domains. In sales, teams compare revenue, pipeline, and win rates across territories or account segments. In marketing, analysts compare campaign performance, channels, and audiences. In operations, leaders compare plants, warehouses, or service centers on efficiency, quality, and cost. Even outside business, comparative dashboards can be used to analyze schools, hospitals, or community programs across locations or time.
A good comparative analysis dashboard does more than display numbers. It supports decision-making. That means it should help users quickly spot outliers, rank entities, and drill into the reasons behind performance gaps. Visual patterns—such as color scales, bar lengths, and trend lines—make it easier to see where attention is needed. Filters and controls allow users to change the lens: for example, switching from monthly to quarterly views or from product-level to category-level comparisons.

Key characteristics of a comparative analysis dashboard
First, it is aligned around a clear comparison question. You should be able to state in one sentence what is being compared: regions, products, teams, time periods, or scenarios. Without this clarity, dashboards often become cluttered collections of charts that do not work together.
Second, it uses standardized metrics and definitions. If you are comparing revenue across regions, each region must follow the same rules for what counts as revenue, which currencies are used, and how returns or discounts are handled. Otherwise, the comparison will be misleading.
Third, it emphasizes relative performance rather than just absolute values. Rankings, percentage differences, index scores, and variance-to-target visuals help users understand not only how much, but “how much compared to what.” For example, a bar chart sorted from highest to lowest revenue immediately shows leaders and laggards.
Finally, it is interactive and exploratory. Users should be able to filter by time, drill into specific entities, and switch between different comparison dimensions. This interactivity turns the dashboard into a tool for investigation rather than a static report.

How to create a comparative analysis dashboard
1. Define the purpose and audience
Start by clarifying who will use the dashboard and what decisions they need to make. Are you supporting executives who want a high-level view of regional performance, or analysts who need detailed breakdowns? Write down the main questions the dashboard should answer, such as “Which region grew fastest this quarter?” or “Which product categories are underperforming versus last year?”.
This step guides every design choice that follows: which metrics to include, how much detail to show, and what level of interactivity is necessary. A focused purpose prevents scope creep and keeps the dashboard lean and effective.
2. Choose the comparison dimensions and metrics
Next, decide what you are comparing and which metrics matter most. Common comparison dimensions include:
- Regions or locations
- Products, services, or categories
- Customer segments or cohorts
- Time periods (year-over-year, month-over-month, before vs. after a change)
- Scenarios or strategies (baseline vs. forecast, control vs. experiment)
For each dimension, select a small set of core metrics. For example, a sales comparison dashboard might focus on revenue, units sold, average deal size, and win rate. Ensure that each metric is clearly defined and calculated consistently across all entities.

3. Prepare and structure the data
A comparative dashboard depends on clean, well-structured data. Organize your data so that each row represents an entity-time combination (for example, region-month or product-quarter) and each column represents a metric or attribute. Include identifiers for the comparison dimension (such as region name or product ID) and for time (such as date or period).
Handle missing values, duplicates, and inconsistent labels before you start building visuals. If you are comparing across systems or countries, standardize units and currencies. This preparation work ensures that your comparisons are valid and that filters and groupings behave as expected.
4. Design the layout for side-by-side comparison
Layout is critical. Arrange visuals so that comparisons are easy and natural. Some effective patterns include:
- Ranked bar charts showing entities from highest to lowest on a key metric.
- Small multiples (repeated charts) where each panel represents a region or product with the same axes.
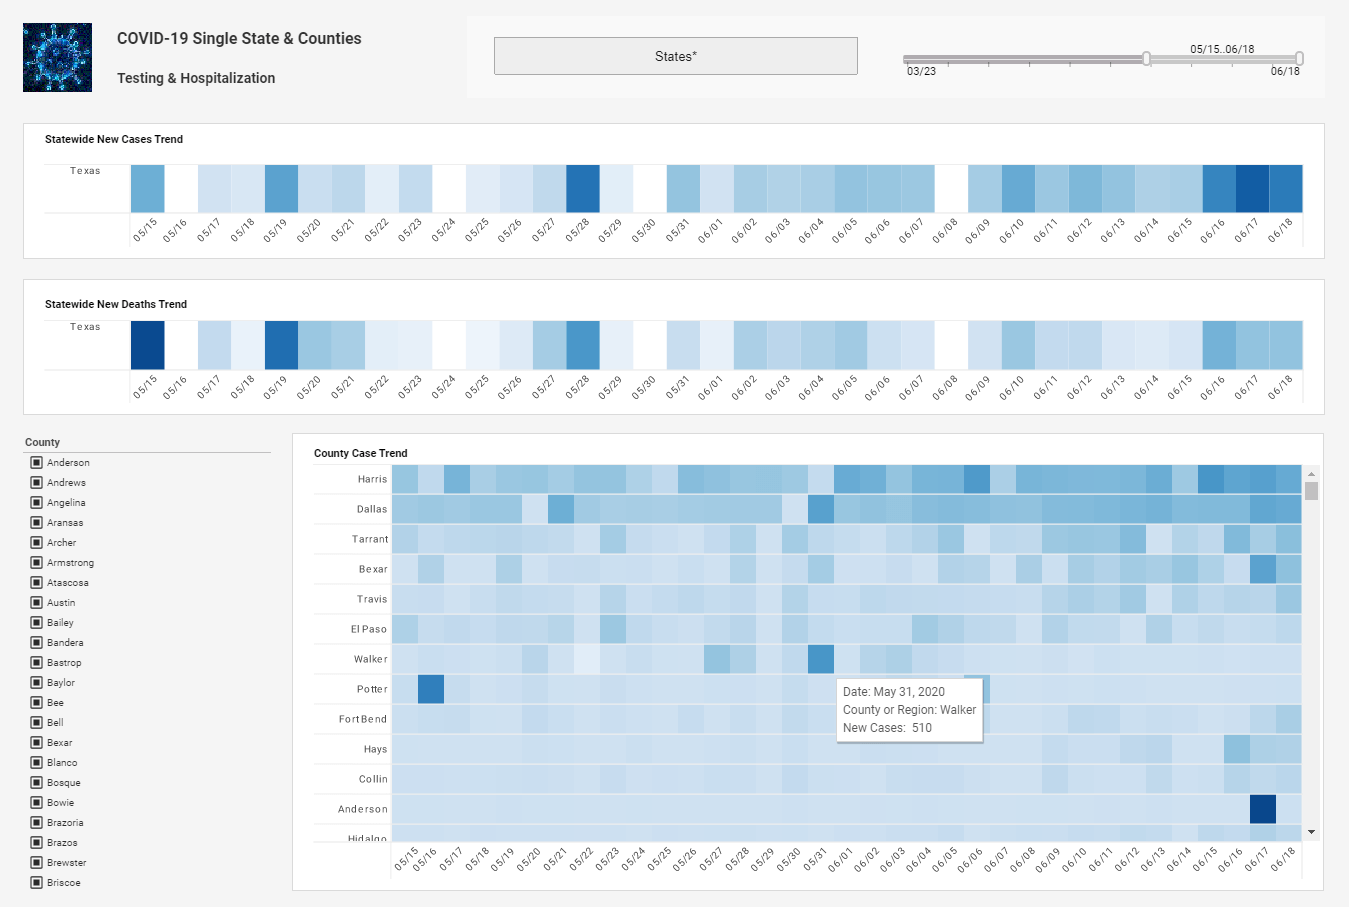
- Heatmaps where rows are entities, columns are time periods, and color encodes performance.
- Variance charts showing actual vs. target or this year vs. last year for each entity.
Keep the number of colors and chart types limited so users can scan quickly. Use consistent scales and axes across related charts to avoid misleading comparisons. Group related visuals together and use clear titles and subtitles that state what is being compared.

5. Add interactivity and filters
Interactivity turns a static comparison into a flexible analysis tool. Add filters for time, region, product category, or customer segment so users can narrow the view to what matters to them. Provide the ability to sort tables and charts by different metrics, such as sorting regions by growth rate instead of total revenue.
Drill-down actions are also powerful. For example, clicking on a region could reveal a detailed breakdown by product, or selecting a product could show performance across customer segments. These interactions help users move from “what is happening” to “why it is happening”.
6. Validate, iterate, and document
Once the dashboard is built, validate the numbers with subject matter experts and sample users. Confirm that the metrics match trusted reports and that the comparisons make sense. Ask users whether the dashboard answers their key questions and what feels confusing or missing.
Iterate on the design based on feedback, removing low-value visuals and refining labels, tooltips, and color choices. Finally, document the metric definitions, data refresh schedule, and intended use of the dashboard. Clear documentation builds trust and helps new users understand how to interpret the comparisons.
When done well, a comparative analysis dashboard becomes a shared lens on performance. It aligns teams around the same numbers, highlights where to focus attention, and supports better, faster decisions grounded in clear, side-by-side evidence.

Additional Resources
Are you looking to compare dashboard options? Start by viewing demos for each one. InetSoft offers Web-based dashboard software that is easy to use and quick to deploy. Read customer reviews. See examples.
Free Visualization Software - If you're looking for free visualization software to perform data mining or explore your data with an easy to use visual analysis tool, try Visualize Free. If you are looking for a way to visually explore and present data that standard office charting software cannot handle, and/or you're not able to install a desktop-based analytics application, Visualize Free is your free Web-based on demand analytics solution. Visualize Free provides an easy way to evaluate some of the capabilities of InetSoft's commercial visual analysis product, which is available as a standalone visual analysis and interactive dashboard application in StyleBI, and as part of a complete business intelligence software application in StyleBI...
Free Visualization Tools - InetSoft has created three free visualization tools that offer productivity to business users and Web developers as well as provide a way to evaluate some of the technology included in the company's commercial business intelligence software for interactive dashboards, visual analysis, charting, and reporting. Style Scope Free Edition is a small-footprint server that delivers Web-based interactive Flash dashboards and visualizations that can be shared within an organization. The Java-based application can be installed on any Windows, Unix, or Mac desktop and can be connected to data in standard relational databases as well as spreadsheets. The kinds of dashboards that can be created range from monitoring and executive dashboards to sophisticated interactive visual analysis and business management dashboards. Visualize Free is a free Web-based visualization software application for performing data mining or exploring your data using visual analysis techniques...
FreshBooks Dashboard Application - Looking for a good dashboard application for FreshBooks? InetSoft's pioneering BI application produces great-looking dashboards that mashup accounting data with other data in your enterprise. View a demo and try interactive examples...
FreshBooks Dashboarding Tool - Looking for a good solution for FreshBooks dashboard reporting? InetSoft's pioneering BI application produces great-looking cloud-based dashboards with an easy-to-use drag-and-drop designer. Mashup your finance data with other enterprise sources for a complete picture of performance. View a demo and try interactive examples...
Freshsales Dashboarding Tool - Looking for a good solution for Freshsales dashboard reporting? InetSoft's pioneering BI application produces great-looking cloud-based dashboards with an easy-to-use drag-and-drop designer. Mashup your sales and other enterprise data for a wider view of performance. View a demo and try interactive examples...

Freshservice Dashboarding Tool - Looking for a good solution for Freshservice dashboard reporting? InetSoft's pioneering BI application produces great-looking cloud-based dashboards with an easy-to-use drag-and-drop designer. Mashup your service desk data with other enterprise data for a wider picture of performance. View a demo and try interactive examples...
Fund Management Company Dashboard KPIs - Monitoring and assessing performance is crucial for a fund manager. Fund management organizations (hedge funds, pension funds, trust funds, mutual funds, and corporate funds) significantly depend on Key Performance Indicators (KPIs) to gauge performance, spot trends, and make defensible judgments about the assets they are tasked with managing on behalf of customers. The key performance indicators (KPIs) that make up a fund management company's dashboard are examined in this article, giving light on how these measurements guide investment strategies and promote financial success. Asset Under Management (AUM), a key performance indicator (KPI), measures the total amount of money that a firm manages. Monitoring AUM growth gives the business information about how well it can draw in new customers and keep existing ones, as well as how well-liked its investment options are...
Fund Raisers Use Dashboards - Organizing a fundraiser can be a daunting task in our day and age. It seems that the world economy has not fully recovered from the pandemic and politics don't make the state of things any better. Obviously, all of this means that people are not as likely to give away their money because they might not even have any money to give away. That being said, this doesn't mean that you shouldn't organize a fundraiser if you really need one. You just need to find tools that will help you achieve your fundraising goals, for instance, a dashboard. Here are the ten most important reasons why fundraisers need to use dashboards for their projects...
Fund Raising Dashboard Example - I am opening up a fund raising dashboard example, and this is the disguised data. It's not their actual data, but the story is very similar. The dashboard comes up with a set of charts. Here we’re looking at a chart of data on the prospects. It’s got a list of all the prospects. There are 93,743 of them. There is some information like their name, how much they’ve given, some descriptive characteristics about how they are affiliated with the school. For instance, this could be anything. You could have phone numbers and emails, and then there are some filters up here so you can chop the data down. Maybe you are only interested in alumni and so forth. Then a project that would typically have a set of pages like this, these are pages that describe the people, how they’re affiliated where they live, what degrees forth and there are some giving history over on the right. So let’s work out a scenario here, what do we want to do? Well the question I asked just a few minutes ago was do we have top rated prospects who are not giving, and who are they? So let's try answer that one. We want ratings so there’s a page on ratings. This is going to take this list of 93,743 people and show different attributes about how they are rated and at the top is a bar chart. It's showing us a visual report...

Geographic Mapping Analytical Dashboard - The Geographic Mapping Analytical Dashboard below shows off the kind of tool that many marketers or organizations can use to conduct thorough research on different demographics in the New York City district. An interactive web-based analytical dashboard, the chart below serves as a easy-to-view and maneuver solution for organizations of varying nature. The dashboard below boasts the rich nature of visuals and filtering options, catering heavily to the user and their interaction with the software. Simple-to-use, the chart below allows users to filter and sort by the different boroughs of New York City and category of the type of groups and dimensions of the people. Right away, the results are beautifully laid out in the map and more specifically, in the bar graph. This type of data and interaction level is very effective and efficient for market researchers or organizations looking to gather data on different demographics. Powerful in every sense, InetSoft's business intelligence solution has provided organizations with the highest quality tools for dashboards, reporting, and data mashup to enhance business operations and objectives...
Global Trade Management Dashboard KPIs and Analytics - With global firms and complex supply chains, global trade management (GTM) has gotten more complicated. Businesses use Global Trade Management Dashboards with KPIs and analytics to manage international trade operations. These technologies help firms make educated choices and improve their international operations by providing insights on global commerce. This article discusses Global Trade Management Dashboards' key KPIs and analytics. Ensuring adherence to international trade rules is crucial for every company involved in international commerce. To efficiently monitor and manage compliance, GTM dashboards include a number of KPIs and analytics pertaining to compliance. These measurements usually include: Customs Compliance Rate: The proportion of shipments that adhere to customs laws is tracked by this KPI. A high percentage of customs compliance lowers the possibility of delays or penalties and indicates effective customs paperwork. Denied Party Screening: Trading partners and clients are screened using analytics techniques against forbidden party lists, such the Entity List maintained by the U.S. Bureau of Industry and Security. In order to stay out of trouble with the law, you must make sure that you do not interact with forbidden parties. Import/Export License Management: These KPIs monitor import and export license status and expiry dates to make sure all required permissions are in place for cross-border transactions...
GoodData Analytic Dashboard Solution Alternative - Are you looking for a good alternative to GoodData's analytic solution? InetSoft's pioneering BI application produces great-looking web-based visual analyses and dashboards with an easy-to-use drag-and-drop designer. Get cloud-flexibility for your deployment. Minimize costs with a small-footprint solution. Maximize self-service for all types of users. No dedicated BI developer required. View a demo and try interactive examples...
Good Analytical Dashboard Vendor - Are you looking for a good analytical dashboard vendor? Since 1996 InetSoft has been making BI software that is easy to deploy and easy to use. Build self-service oriented dashboards and visual analyses quickly. View a 3-minute demo and download a free version...
Good Dashboard Company - Business intelligence strategy demands real time data for enterprise reporting. InetSoft offers the most beautiful dashboards through the powerful StyleBI™ software. The StyleBI™ software is easy to use and employs real time reporting capabilities(through relational and multidimensional databases). InetSoft’s distinctive Data Block™ technology creates stunning visual mashups to create the perfect dashboard design...
Good Digital Dashboard Software for Tracking KPIs - Looking for a good digital dashboard for tracking KPI? Since 1996 InetSoft has been making business dashboard software that is easy to deploy and use...

Good Information Dashboard Examples - Information dashboards allow business's to select certain aspects of their business to track. They can tack everything from sales profits over the past week, to employess salaries over the past two years. Information dashboards can give you that competitive edge that you need in order jump ahead of the competition. Good information dashboards allow users to fully manipulate data to conform to their particular business needs. With InetSoft's unique drag and drop dashboard design, you are able to fully customize reports geared toward your specific business. You have full control over with metrics and key performance indicators (KPI) that you wish to choose, and are able to combine and conform them to meet your growing business needs....
Good Management Dashboard Examples - Good management dashboards can take your business from an average one, to one that is ahead of the curve. Management dashboards give your business the ability to track and change data that you would normally have little understanding about. Good management dashboards will allow the users to specifically track business metrics, key performance indicators (KPI), and sales performance figures. These three elements are essential to any business who goal is maximizing profits. With easy to read graphical representations of your business's data, you are able to adjust quickly to any changes in your business. InetSoft's unique drag and drop dashboard design gives the end users full control of which key metrics they want to evaluate, which in turn leads to increased efficiency when establishing new policies and strategies...
Good User Interface for Interactive Dashboards - But with this most recent release we are switching over into using HTML also on the visualization side while still providing a pretty good user interface for accessing interactive dashboards. Okay let me switch over into my browser. Here I can actually share an HTML version of one of the interactive dashboards by sort of convincing our software to present it in the HTML form. This would also be useful on an environment that wouldn’t allow the Flash plug-in to be installed even if it wasn’t an iOS or BlackBerry but is a non-Flash supporting environment. So you see most of the capabilities, the selection lists, the range sliders, everything updates on the fly and is similarly capable in the HTML version. I am also going to show you now the Visual Composer. Here I have just created a new dashboard based on some existing data mashup that I have. And for those of you who haven’t seen a full demo, yet, here is just a little taste. Basically you drag some visual elements in from the left hand side and then connect them to data. For instance, this is showing you the total quantity here, filtering on states here...

Google Search Console Dashboarding Tool - Looking for a good solution for Google search console dashboarding? InetSoft's pioneering BI application produces great-looking dashboards that mashup SEO performance data with other marketing campaign data in your organization. View a demo and try interactive examples...
GoSquared Dashboard Tool - Looking for a good solution for GoSquared dashboard reporting? InetSoft's pioneering BI application produces great-looking cloud-based dashboards with an easy-to-use drag-and-drop designer. Create comprehensive views of your website, CRM, communications, and all other orgranizational data with InetSoft's data mashup engine. Watch a demo and try interactive examples...
Government Spending Analysis Dashboard - The Government Spending Analysis Dashboard below provides the perfect solution for the American Recovery and Reinvestment Act of 2009 that forces governments to be more transparent with information regarding the public. InetSoft's technology thrives off of efficiency along with power to provide users with a top of the line and easy-to-manage business intelligence solution. Included in the dashboard solution is an abundance of useful and intuitive tools and features that assist users in creating a visualization friendly to the user. Along with a large collection of usable charts, tables, and graphs, InetSoft's software uses a specialized data mashup technology called Data Block to gather various data from different sources and represents it visually on a chart for users to look at and monitor easily. What's even greater is the amount of control users have to filter and sort different sources like government agency, government bureau, category of spending, and the award type to analyze specific sets of information to match their wants and needs. InetSoft's solution is a reliable and safe option for organizations of varying nature as we continue to strive towards a more creative and effective innovation in dashboard creation, reporting, and data mashup to assist users in everyday business operations...
Graph Visualization Software - Looking for a graph visualization software application to plot your data in a visually comprehensible manner? InetSoft's dashboard software combines all common styles of graphing with interactive filtering, allowing you to comb your data for new insights into patterns and trends. Since business users will often begin the data exploration process without a clear idea what their questions are, they require a flexible tool that encourages them to experiment with different methods of analysis and modify their analysis as they go along. InetSoft's graph visualization software is a powerful but flexible tool...
Great Dashboard Creation Tool - Looking for great dashboard creation tools? InetSoft's pioneering dashboard reporting application produces visually appealing web-based dashboards with an easy-to-use drag-and-drop designer. Maximize self-service for all types of users. View a demo and try interactive examples...
Great Dashboards - As enterprises and other organizations look to make sense of the all the data available to them, dashboards are being positioned as the solution to their problems. However, a dashboard needs special attention to the visual design or the dashboard will fail to meet expectations. If not carefully designed, a new dashboard can leave consumers unsatisfied, frustrated, confused, and even overwhelmed. A dashboard is often the first screen that a user sees in your UI. The importance of visual design and data visualizations is high. Beautiful dashboards are worthless however, if the presented information isn’t useful to the user to accomplish their tasks...
Greener BI Dashboard App - Most legacy BI platforms rely on static, always-on server environments. Even during periods of low usage, these systems consume substantial electricity, which translates into higher carbon emissions. Fixed-capacity servers, whether in a private data center or cloud-hosted virtual machines, operate continuously, often far below their maximum workload. For developers, this inefficiency can create bottlenecks as scaling up often means provisioning more servers, further increasing power consumption. By contrast, a serverless architecture automatically scales to the workload, ensuring that computation occurs only when necessary, thereby reducing unnecessary energy expenditure. StyleBI’s serverless architecture allows developers to deploy dashboards, reports, and analytics pipelines without worrying about the underlying infrastructure. When a user queries data or renders a dashboard, StyleBI spins up the required compute resources and shuts them down automatically after use. This elasticity not only improves resource utilization but also reduces idle server time, which is a significant contributor to energy waste in traditional BI deployments. Developers benefit from a system that grows and shrinks according to demand, enabling rapid experimentation and scaling without incurring the environmental cost of over-provisioned servers...
Guide to Building an Ecommerce Dashboard - With regards to running an effective internet-based store there's a great deal to monitor. From undeniable level measurements like income or number of requests, down to more itemized data, for example, client input, there basically isn't one internet business investigation toll that covers everything. So as an entrepreneur, how might you administer every one of the various pieces of your web-based store without burning through minutes or even hours each time you want to look into a few significant pieces of information...