Geographic Mapping Analytical Dashboard
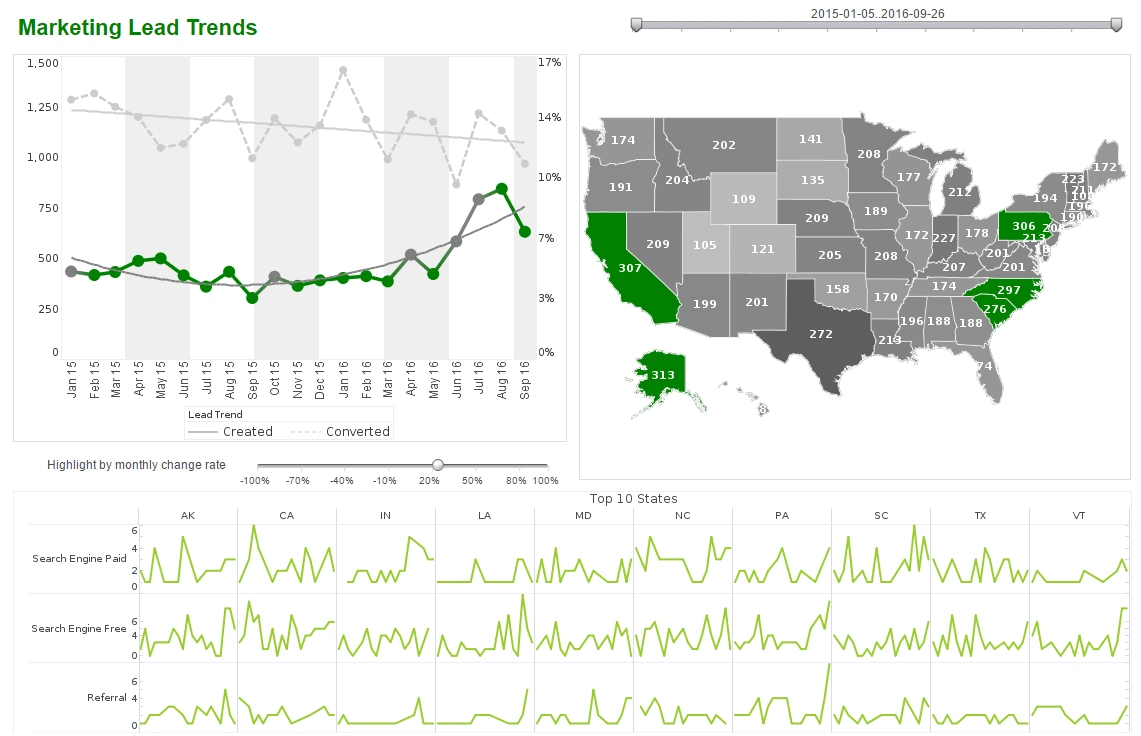
The geographic mapping analytical dashboard here shows off the kind of tool that many marketers or business analysts can use to conduct thorough research on different data points based on geography, zip code, MSA, state, province, or country. An interactive web-based analytical dashboard, the chart here serves as a easy-to-view and navigate solution for organizations of any type.
The dashboard boasts the rich nature of visuals and filtering options, catering heavily to the user and their interaction with the software. Simple-to-use, the chart allows users to filter and sort by different regions, categories, and dimensions of the people.
Right away, the results are beautifully laid out in the map and more specifically, in the bar graph. This type of data and interaction level is very effective and efficient for organizations looking to analyze data on different demographics.

Powerful in every sense, InetSoft's business intelligence solution has provided organizations with the highest quality tools for dashboards, reporting, and data mashup to enhance business operations and objectives.

Capabilities of InetSoft's Geographic Mapping Analytical Dashboard
- User-friendly interface for easy filtering and sorting options
- Interactive data mashup for quick and effective analysis
- E-mail, import, export, and print visual analysis
- Easy multi-tasking to compare charts and graphs while drilling down into details
- View data from multiple sources and formats on one dynamic screen
- Use Google maps, standard countries and regions, and custom maps
- Maximum self-service of all user types
InetSoft's BI application makes a good choice because it's...
Easy
- Enjoy a rapid implementation; minimum specialized IT expertise required
- Experience a shallow learning curve for business users; only Excel-level skills needed
- Make it easy for analysts & administrators; no SQL experience required
- Scale up with zero-client deployment and no per-user licensing
Agile
- Provide maximum self-service through ad hoc and visualization analysis
- Enable self-service also at data level: end-user defined data mashup
- Accommodate quick, formal, and experimental changes
Robust
- Address advanced and mass needs
- Run on a high performance, secure infrastructure
- Leverage built-in Spark clustering
How Does a Franchise Performance Marketing Manager at a Car Rental Company Use Geographic Mapping Analytics?
A Franchise Performance Marketing Manager at a car rental company plays a crucial role in driving business growth and ensuring the success of individual franchise locations. Geographic Mapping Analytics is an invaluable tool for them, allowing them to make data-driven decisions to optimize marketing efforts and increase profitability. Here's a detailed explanation of how they might utilize this tool:
-
Market Segmentation and Targeting:
- The manager can use geographic mapping to divide the market into segments based on location, demographics, and behavior. This helps in understanding which areas have the highest demand for car rentals.
- By identifying high-potential regions, the manager can allocate resources and marketing budgets more efficiently. For example, if a particular city has a high volume of tourists, they can focus marketing efforts on that location.
-
Competitive Analysis:
- Geographic mapping allows the manager to plot the locations of competitors in the area. This provides insights into market saturation and helps in identifying underserved areas.
- By understanding where competitors are located, they can strategically position their franchise to capture a larger market share.
-
Site Selection for New Franchises:
- When considering opening a new franchise location, the manager can use mapping analytics to evaluate potential sites.
- They can analyze factors like proximity to airports, tourist attractions, and local businesses, as well as assess the accessibility and visibility of the location.
-
Marketing Campaign Planning:
- By overlaying demographic data onto geographic maps, the manager can create highly targeted marketing campaigns. For instance, if a neighborhood has a high percentage of young professionals, they can tailor promotions to suit their preferences.
-
Optimizing Advertising Channels:
- Mapping analytics can help identify which advertising channels are most effective in specific regions. For example, social media advertising might be more effective in urban areas, while radio ads might work better in rural regions.
-
Seasonal Trends and Demand Forecasting:
- By analyzing historical rental data along with geographic information, the manager can predict seasonal fluctuations in demand.
- This allows for better preparation in terms of staffing, inventory levels, and marketing strategies during peak and off-peak seasons.
-
Performance Evaluation of Existing Franchises:
- The manager can compare the performance of different franchise locations using geographic mapping. They can identify trends and outliers, enabling them to implement strategies that have been successful in one location to improve performance in others.
-
Customer Behavior Analysis:
- Geographic mapping can be used to track customer movement patterns. This information is invaluable for understanding how customers move within a city or region, which can inform decisions about where to place advertising and promotions.
-
Regulatory Compliance:
- Different regions may have varying regulations and policies regarding car rentals. Mapping analytics can help ensure that each franchise location is in compliance with local laws.

How Does a Media Planner at an Advertising Agency Use Geographic Mapping Analytics?
A Media Planner at an advertising agency is responsible for designing and implementing advertising campaigns to reach target audiences effectively. Geographic Mapping Analytics is an indispensable tool in this role, providing valuable insights into consumer behavior, regional trends, and optimal media placement. Here's a detailed explanation of how a Media Planner might utilize this tool:
-
Target Audience Identification:
- Geographic mapping allows the Media Planner to visualize where their target audience is located. This could be based on factors such as demographics, psychographics, and purchasing behavior.
- By understanding where their audience resides, the Planner can select media channels and locations that are most likely to reach and resonate with them.
-
Market Potential Assessment:
- The Planner can use mapping analytics to assess the market potential of different regions. They can evaluate factors like population density, income levels, and consumer preferences.
- This information helps in allocating advertising budgets effectively by prioritizing regions with the highest potential for ROI.
-
Competitive Analysis:
- Mapping allows the Media Planner to plot the locations of competitors' stores or business outlets. This provides insights into where competitors are focusing their advertising efforts.
- By identifying areas with a high concentration of competitors, the Planner can choose to either compete head-on or explore alternative regions with lower competition.
-
Media Channel Selection:
- Different media channels have varying levels of effectiveness based on location. For instance, outdoor billboards might be more impactful in high-traffic urban areas, while local newspapers may be more effective in smaller towns.
- Geographic mapping helps in optimizing media channel selection to ensure the message reaches the right people in the right place.
-
Localized Messaging:
- By overlaying demographic data onto geographic maps, the Planner can create localized advertising messages that resonate with specific communities or regions.
- This personalization increases the likelihood of consumer engagement and conversion.
-
Optimizing Store Openings or Events:
- When planning store openings or events, the Media Planner can use mapping analytics to choose locations with high foot traffic or proximity to their target audience.
- They can also use this data to promote the event through local advertising channels.
-
Media Budget Allocation:
- Mapping analytics can inform the allocation of advertising budgets across different regions. For example, if one region has a higher concentration of potential customers, it may warrant a larger share of the budget.
-
Seasonal and Regional Trends:
- Geographic mapping combined with historical data can reveal seasonal and regional trends in consumer behavior. This helps in timing campaigns for maximum impact.
-
Performance Tracking and Reporting:
- After a campaign is launched, the Media Planner can use geographic mapping to track performance by region. This allows for real-time adjustments and provides valuable data for post-campaign analysis.

More Articles About Using Geographic Mapping Analytics
About Creating Performance Management Charts - You can use InetSoft's BI software to quickly and easily create any kind of performance management chart you wish. From speedometers to thermometers to traffic lights, you can use any imagery you like. Popular chart types like bullet charts showing percent of goal attainment are also possible. Read articles below for more information, or watch a 2-minute demo...
Can Do Special Kinds Of Joins - Let's say I have my CRM data and MySQL data. Let's say I have my order processing data in Oracle, and I want to correlate my marketing campaign with my revenue. I normally have to basically create an ETL process and get data from MySQL and Oracle and build a data warehouse. But with InetSoft, you can just drag and drop from different data sources and make your own mashup...
Charting Tools Product Features - Here you will find help topics and product information about InetSoft's free and commercial charting applications. This page discusses the uses of Candlestick charts, and explains how you can create them in both Google Sheets and InetSoft. This page also provides access to a free online tool for creating Candlestick charts and complete functioning business intelligence dashboards. A "Candlestick" or "Candle" chart is a financial...

How to Create the Mandlebrot Set - The key step in plotting the Mandelbrot set is to obtain the number of iterations for each value in the domain, which for the X axis is (-2.00, 0.47) and for the Y axis is (-1.12, 1.12). You can implement the algorithm within an Expression Column of a Data Worksheet. To do this, follow the steps below...
How to Localize Report Elements - Users of InetSoft's reporting software are able to localize report elements in order to suit regional or international preferences. View the example below to learn more about the StyleBI solution. Most text elements in a report, as well as data source names, data model names (entity/attribute), and query (column) names, can be localized via a simple text mapping...
Include a Chart on a Web Page - Do you want to include a chart on a Web page? InetSoft offers free and commercial software for Web-based charting and graphing. Style Scope Enterprise Edition, is the enterprise and OEM-ready chart software product, Visualize Free is the company's free web-based charting application, and Style Scope Agile Edition is a free downloadable charting product, free for up to two users...
InetSoft's Business Intelligence Mapping Software - InetSoft's business intelligence mapping software allows for interactive analysis of geographic performance. InetSoft is top-rated by users on G2 Crowd. Interact with examples and register for a personalized demo... Information About Visualization Software - /info/information_visualization_software/ This is a table of contents of useful product information about, and benefits of, InetSoft's information visualization capabilities built into its business intelligence software for dashboards, reporting, and analytics. If you have data in a spreadsheet, you can quickly upload it. Then with a drag and drop designer you can create a visualization...

Inserting a Map in a Report - In the following example you will create a Map which displays customer dispersion across the United States. Open the Designer and click the 'New' button. In the 'Create Report' dialog box, select 'Blank Tabular Report' and click 'OK'. Click the 'Map' button to add a Map element to the report. Note: Since mapping data has to be loaded, there may be a delay before the map is rendered...
Mapping File Controls Localization - The "srinter" mapping file controls localization for interface text (tabs, tree nodes, Ad Hoc controls, etc.). The "SreeBundle" mapping file controls localization for report text (text in tables, charts, etc.) and data model/query names. The two files are discussed in the following sections. To implement either level of localization, you first need to register the desired locales in the 'Localization' page of the Enterprise Manager...
Map Text from One Value to Another - Resource bundles are a concept introduced in JDK1.1 specifically for internationalization. A resource bundle is implemented as a Java class. It implements an API that basically provides a mapping of object values. The difference between a resource bundle and a regular Java class is the way they are located and loaded. A regular Java class is uniquely identified by a fully...
Regionalizing Report PDF Options - InetSoft's reporting software has extensive customization options that allow users to regionalize their report pdf options to suit diverse needs and uphold data security. View the information below to learn more about the StyleBI solution. To support CJK characters: The location (folder path) of the CJK font files must be specified under the heading TrueType/CID Font Path...

Resources for Business Charting Solutions - Looking for a business charting solution? InetSoft offers commercial and free Web-based charting applications for developers, enterprises and ISV's. Free eval download. View a demo. Read customer reviews. A Sunburst Chart displays each level of a data hierarchy as a series of concentric rings, with each ring representing a level in the hierarchy...
Services for Free Visualization and Charting - If you're looking for Style Chart, InetSoft's free embeddable charting service, we've replaced it with Visualize Free, an easy-to-use, no software download Web-based charting and visualization application. Derived from our commercial business intelligence software, this free charting tool is designed to be very intuitive and interactive...
Solution to Design a Business Dashboard - Designing a dashboard can be challenging, but when done properly can be very beneficial for your business. It's important to know what the best dashboard practices are. The benefit of a dashboard is that everything is in once place therefore it allows the user to quickly understand information through well designed graphs and charts that make the data easier to see visually...
What Is a Data Mapping Tool? - A data mapping tool is a software program that allows you to create a visual representation of the data you have collected. It's a great way to organize and understand your information, which can be especially helpful when trying to make sense of large data collections. For instance, if you want a consolidated view of data, the data mapping tool will consolidate the data...