Why Consider InetSoft Over Simple Charting-Only Tools
- Beyond Charts to Full Analytics: Simple charting tools focus on visualizing data, but like Google Charts, Chartio, StockCharts, Lucidchart, and Plotly, often lack the broader analytical capabilities needed for modern business intelligence. With they stop at rendering static or lightly interactive charts. InetSoft delivers a full analytics environment that supports exploration, transformation, and dashboarding in one place. This eliminates the need to stitch together multiple tools to achieve a complete analytical workflow.
- Data Mashup Capabilities: Many charting tools require pre-modeled data, forcing reliance on IT teams. InetSoft mashes up data from multiple sources on the fly, including databases, spreadsheets, cloud apps, and APIs. This allows users to combine disparate data sources without building complex pipelines, dramatically reducing time to insight.
- Self-Service Data Preparation: Charting tools often assume that data is already clean and structured. InetSoft includes built-in data preparation features such as joins, unions, calculated fields, and filtering. Business users can shape their data without needing SQL expertise or separate ETL tools.
- Real-Time Data Access: Static charting tools often rely on periodic data extracts. InetSoft supports live connections, enabling dashboards to reflect up-to-the-minute information. This is critical for operational monitoring, financial reporting, and performance management.
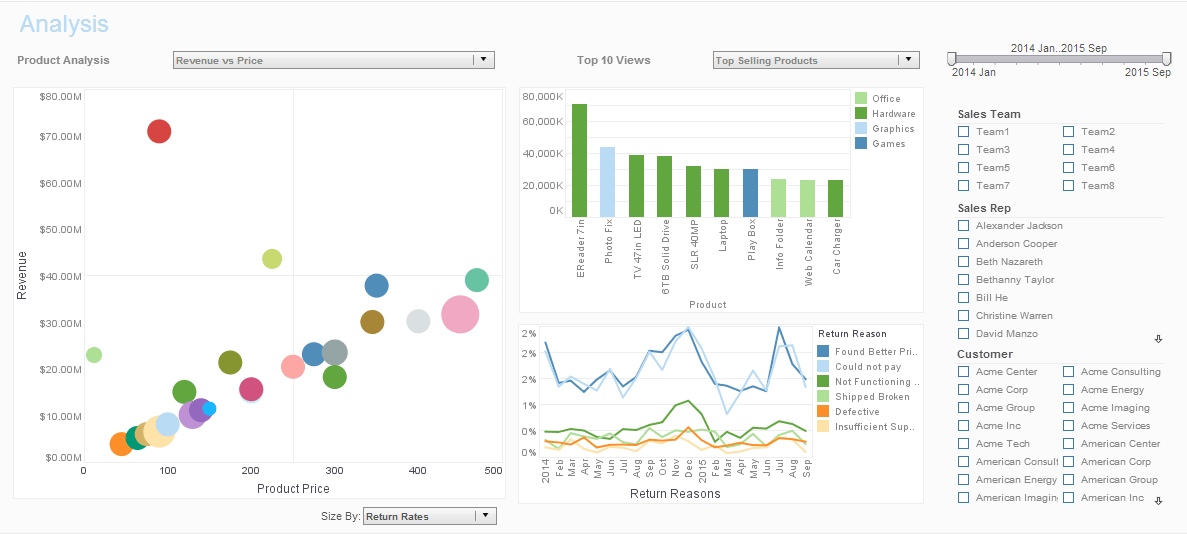
- Interactive Dashboards Instead of Static Charts: While basic tools create isolated visuals, InetSoft enables fully interactive dashboards. Users can drill down, filter dynamically, and explore relationships across multiple charts. This turns passive reports into active decision-making tools.
- Pixel-Perfect Reporting and Dashboards Together: Organizations often need both formatted reports and interactive dashboards. Charting-only tools rarely handle both well. InetSoft provides production reporting alongside modern dashboards, ensuring consistent data delivery across use cases.
- Scalable Architecture: Simple charting tools can struggle as data volume and user counts grow. InetSoft is designed for enterprise scalability, supporting large datasets and concurrent users. It can handle both small deployments and large-scale analytics environments.
- Distributed Analytics Architecture: As organizations grow, analytics needs become more complex and geographically dispersed. InetSoft supports distributed deployments across multiple locations, ensuring consistent analytics regardless of where data or users are based. This is particularly valuable for enterprises with global operations.
- Embedded Analytics Capabilities: Many organizations need to integrate analytics into their applications. InetSoft provides robust embedding options, allowing dashboards and reports to be seamlessly integrated into web apps and portals. Charting libraries may offer embedding, but lack the backend intelligence needed for full analytics.
- Advanced Data Visualization Options: InetSoft supports a wide variety of visualization types beyond basic charts, including heatmaps, geographic maps, trellis charts, and advanced analytical views. This enables richer storytelling and deeper insight than simple bar or line charts.
- Drill-Down and Drill-Through Analysis: Charting tools often display summarized data without context. InetSoft allows users to drill down into granular details or drill through to related datasets. This helps uncover root causes instead of just identifying trends.
- AI-Assisted Insights: InetSoft incorporates intelligent features that suggest patterns, anomalies, and relationships within data. Charting-only tools require manual interpretation, while InetSoft helps guide users toward meaningful insights.
- Security and Governance: Enterprise data requires strong security controls. InetSoft supports role-based access, data-level security, and centralized governance. Simple charting tools typically lack robust security frameworks, making them less suitable for sensitive data environments.
- Flexible Deployment Options: InetSoft can be deployed on-premises, in the cloud, or in hybrid environments. This flexibility allows organizations to align analytics with their infrastructure strategy. Charting tools are often limited to client-side or cloud-only usage.
- Customization and Extensibility: InetSoft offers extensive customization options, including scripting, API integration, and styling. Organizations can tailor dashboards to their specific needs. Charting tools may allow visual tweaks but often lack deeper extensibility.
- Reduced Dependence on IT: With data mashup and self-service features, business users can create their own dashboards and reports. This reduces bottlenecks and accelerates decision-making. Charting tools often still require backend support for data preparation.
- Unified Platform Experience: Using separate tools for data prep, charting, and reporting leads to fragmentation. InetSoft consolidates these capabilities into a single platform, improving efficiency and reducing maintenance overhead.
- Faster Time to Insight: By eliminating data silos and enabling real-time interaction, InetSoft shortens the path from raw data to actionable insights. Charting tools often require multiple steps and tools before meaningful analysis can begin.
- Better Collaboration: InetSoft dashboards can be shared, scheduled, and distributed across teams. Users can interact with the same data views, ensuring alignment. Simple chart exports do not support collaborative exploration.
- Mobile Accessibility: InetSoft dashboards are responsive and accessible on mobile devices. Decision-makers can access insights on the go without losing functionality. Many charting tools are not optimized for mobile interaction.
- Cost Efficiency Over Time: While simple charting tools may appear inexpensive, additional tools for data preparation, reporting, and integration can increase costs. InetSoft consolidates these capabilities, reducing total cost of ownership.
- Handling Complex Use Cases: Advanced analytics scenarios such as financial modeling, supply chain optimization, and customer journey analysis require more than simple charts. InetSoft supports these complex use cases with flexible data handling and visualization capabilities.
- Consistent Data Definitions: InetSoft enables centralized data definitions and metrics, ensuring consistency across dashboards. Charting tools often lead to discrepancies when users define metrics independently.
- Support for Big Data and Cloud Sources: Modern organizations rely on diverse data ecosystems. InetSoft connects to big data platforms and cloud services, making it easier to analyze large and distributed datasets.
- Professional Presentation Quality: InetSoft allows for polished, production-ready dashboards and reports. This is important for executive presentations and external reporting, where visual quality and consistency matter.
- Future-Proof Analytics Investment: Choosing a tool that goes beyond charting ensures long-term value. InetSoft evolves with organizational needs, supporting more advanced analytics without requiring a platform change.

More Articles About Charting
How To Automate Decisions and Actions - We see a lot of organizations looking at how to automate decisions and actions. Thinking back to the idea of embedding business intelligence in systems, organizations are certainly very much looking at how they can take decisions that are routine or repeated decisions and figure out how they can automate them using software. Lots of these things are tending in the direction of improving the idea of embedding BI. Looking again just a little closer to the user experience, self-service BI and analytics has been the dominant trend and certainly is still something that we see organizations trying to pursue. Some hit a wall though because, again, the inability to bring in those non technical users. Many knowledge workers who are using line of business applications, more point applications, and don't have the time or the skills or even some of the interest to dive in and really learn about BI and analytics to be able to access more data and work interactively with the data. They want their dashboards in an easier environment that fits with their subject matter expertise and their level of experience in working with data which is often not high. Along with this, of course, the user IT relationship is changing. Self-service is great for empowering users because users know better what they need. They often know the data. They can ask the right questions. It's often difficult for IT or BI developers to understand what the users are looking for, so self-service BI is for the good...


How to Create Candlestick Charts - This page discusses the uses of Candlestick charts, and explains how you can create them in both Google Sheets and InetSoft. This page also provides access to a free online tool for creating Candlestick charts and complete functioning business intelligence dashboards. A "Candlestick" or "Candle" chart is a financial chart that displays the high, low, open, and close prices of a security for a specific period. It is often used to visualize stock prices over time. Each candle is composed of a body (or box) and an upper tail and lower tail (or wick). The bottom of the lower wick represents the low value for the security over the specified period. The top of the upper wick represents the high value for the security over the specified period...
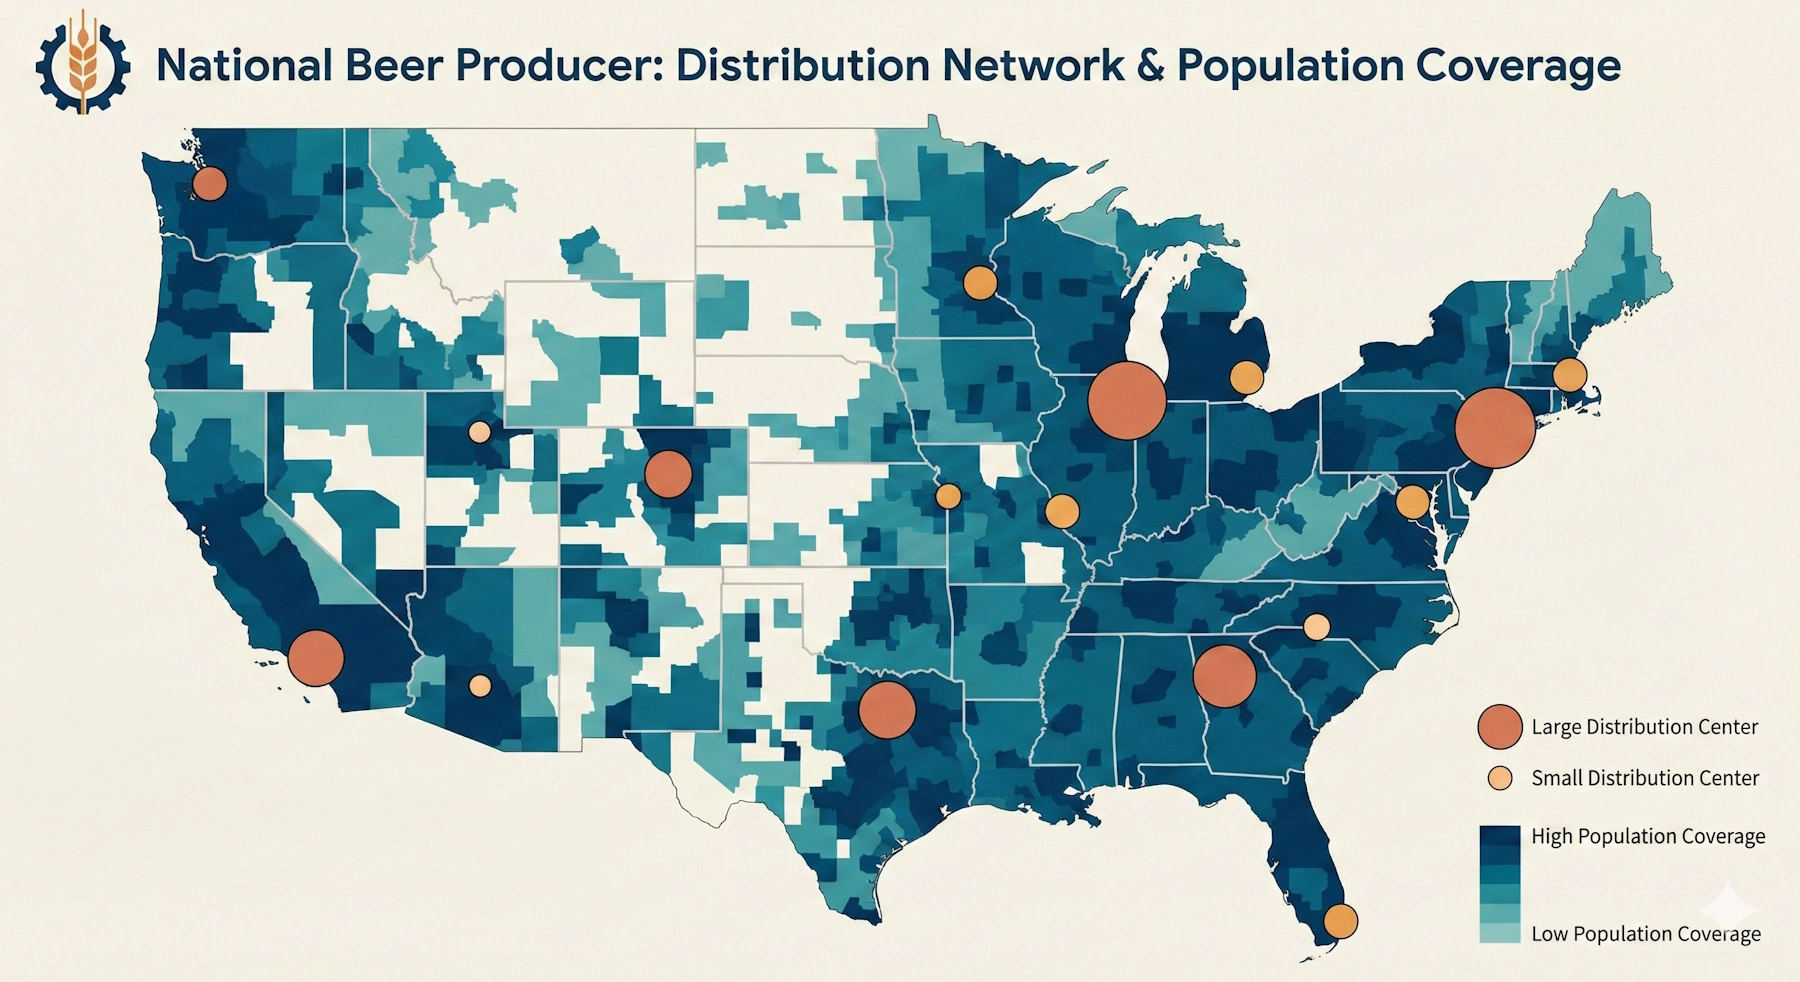
How to Make a Map With Path in InetSoft - To display data on a map by latitude and longitude, follow the steps in the walk-through below. Walkthrough: The 'Map Points' Data Worksheet can be found in the 'Examples' folder. In this example, you will label a map with a list of landmarks along Historic Route 66. The locations of the landmarks are provided by the 'Map Points' Data Worksheet data block, which contains raw latitude and longitude data. The 'Map Points' Data Worksheet can be found in the 'Examples' folder. Follow the steps below:...
How to Make Bullet Charts - This page discusses the uses of bullet charts, and explains how you can create them in both Google Data Studio and InetSoft. This page also provides access to a free online tool for creating bullet charts and complete functioning business intelligence dashboards. A bullet chart is a graphical display that is used to compare the performance of a measure to a target value, and is also sometimes referred to as a bullet graph or a performance bar chart. It consists of a horizontal bar that represents the range of possible values for the measure, with a smaller bar representing the actual value of the measure and a symbol, typically a small circle, triangle, or bar, representing the target value. For example, a bullet chart might be used to show the sales performance of a company compared to its sales target for a particular month. The chart would show the range of possible sales values, the actual sales for the month, and the target sales value. By looking at the chart, it would be easy to see how close the company came to meeting the target...
How to Make Funnel Charts - This article will discuss the uses of Funnel Charts, how you can create them in Google Sheets and InetSoft, and will provide access to a free online tool for creating Funnel Charts and complete functioning business intelligence dashboards. A Funnel Chart typically displays the sequential stages of a process, where the aggregate for each stage represents a subset of the aggregate from the previous stage. This results in the characteristic monotonic narrowing that creates the "funnel" shape. An example is shown below: Here each stage in a sales process represents a refinement of the stage above it: Only a fraction of sales leads produce sales calls, while only a fraction of those sales calls yield follow-ups, and so on until the channel ends with the final successful sales numbers. This "funnel" representation is simply a helpful way to visualize the narrowing or "winnowing" of data in each successive stage...
How to Make a Gantt Chart in InetSoft - Configure your data: The data for a Gantt chart should be the start and end times for tasks, as well as any milestones, as shown below. See Prepare Your Data for information on how to manipulate your data, if it is not currently in this form. To create a Gantt chart, follow the basic steps below. Press the 'Select Chart Style' button . Choose the 'Gantt' style. Press the 'Apply' button...
How to Make a Heat Map in InetSoft - This page will discuss the uses of heat maps, show you how to create them in InetSoft, and provide access to a free online tool for creating heat maps as well as complete functioning business intelligence dashboards....
How to Make a Pareto Chart in InetSoft - To create a Pareto chart, follow the basic steps below. Configure your data, and open a chart for editing. Press the 'Select Chart Style' button. Choose the Pareto style. Press the 'Apply' button...
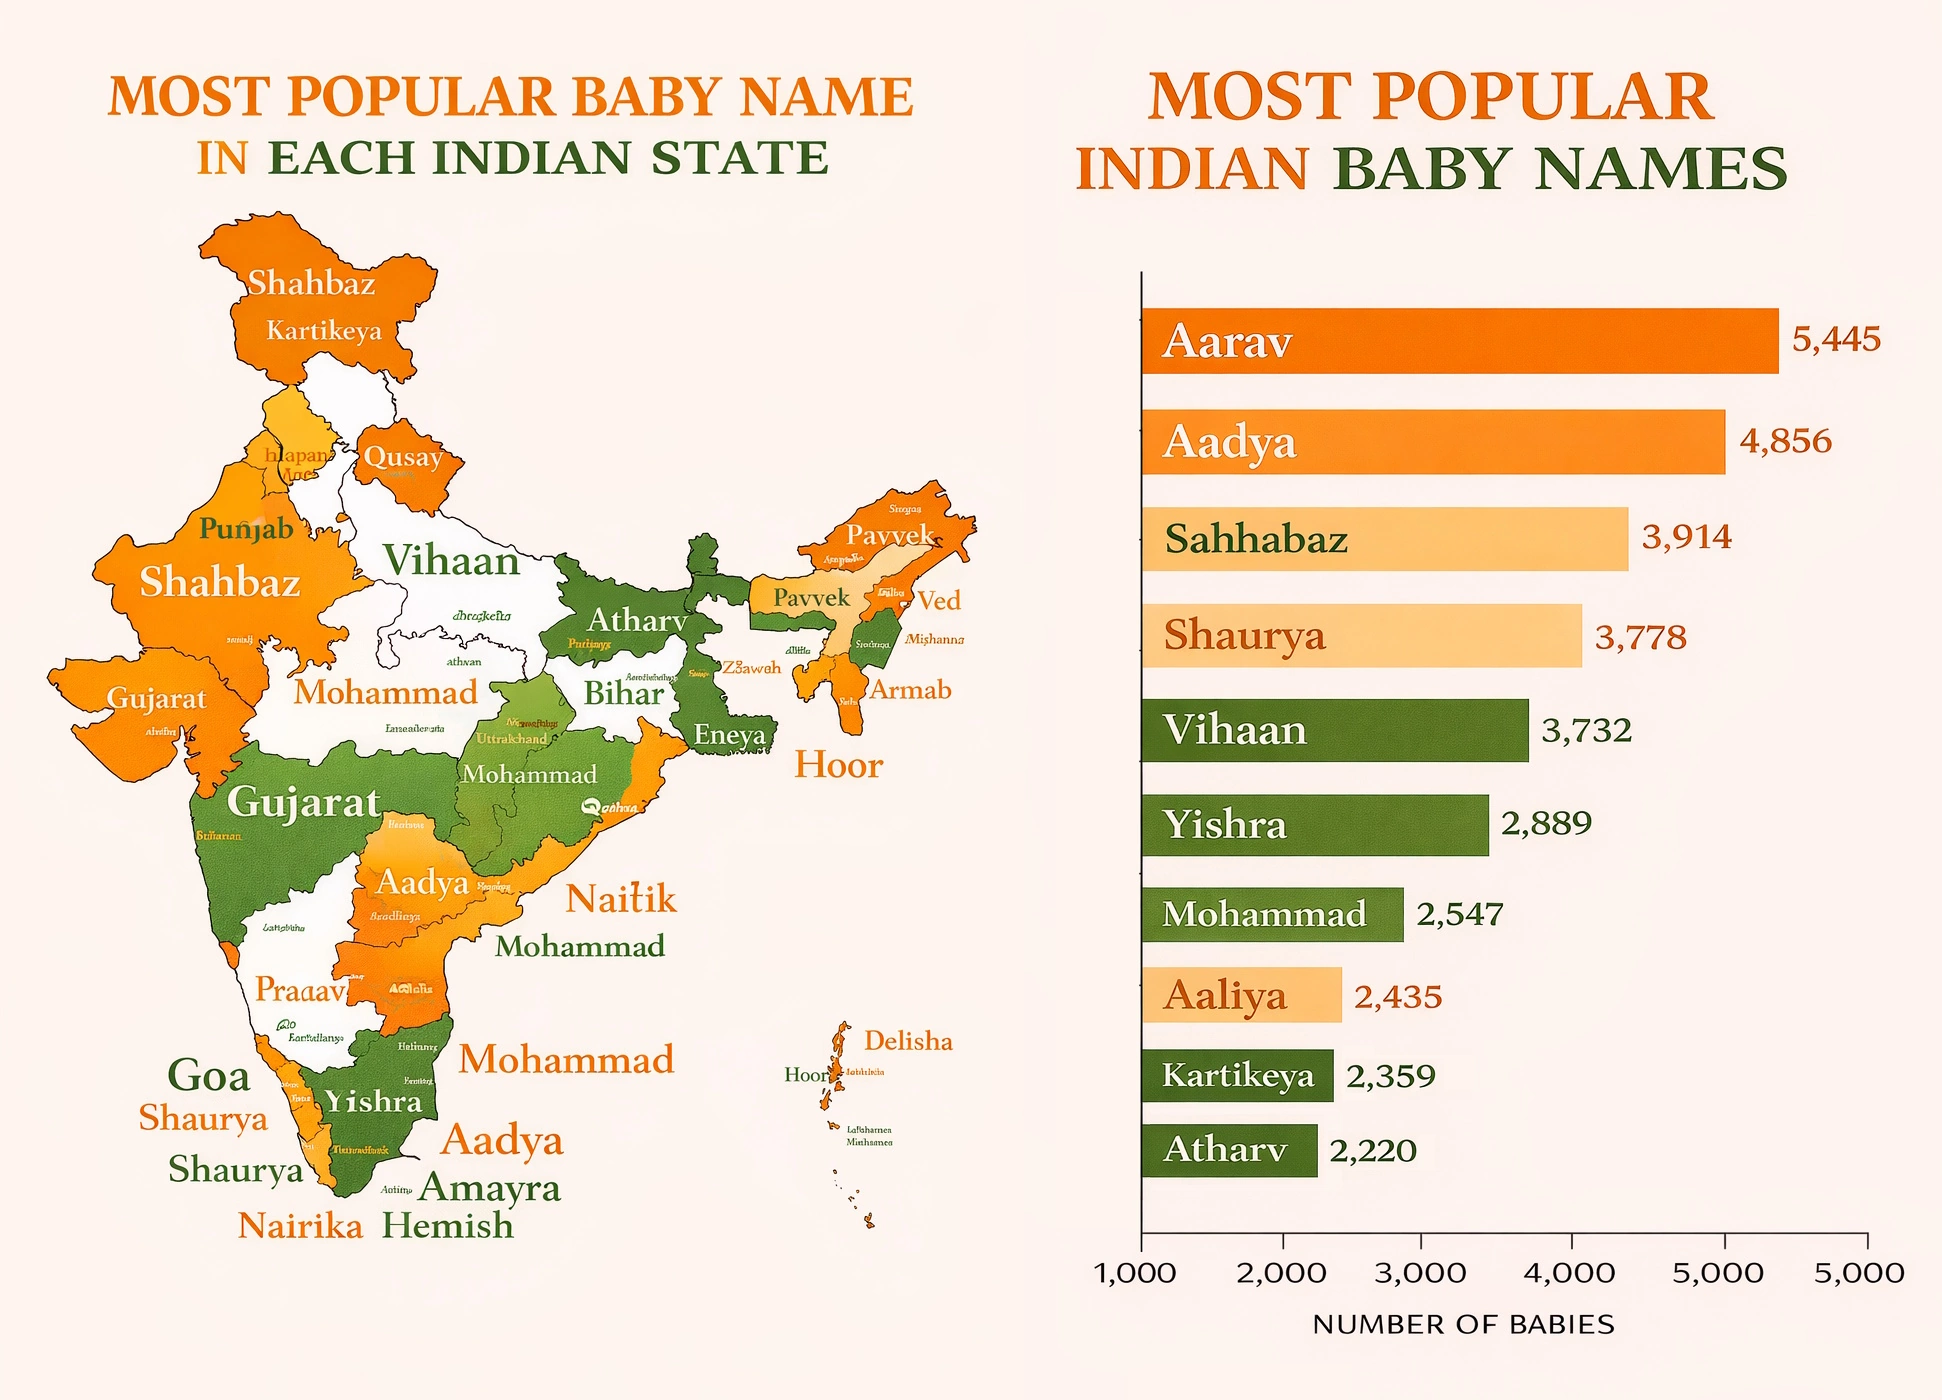
How to Make a Regional Map in InetSoft - This page will discuss the uses of regional maps, show you how to create them in InetSoft, and provide access to a free online tool for creating regional maps as well as complete functioning business intelligence dashboards...
How to Make a Sunburst Chart in InetSoft - To create a Sunburst chart, follow the basic steps below. Place the desired hierarchical dimensions in the 'T' region in the Chart Editor, and place the desired measure in the 'Size' region of the Chart Editor. Use the 'Color' region to distinguish particular dimension values by color. NOTE: To create a grid of charts, place dimensions into the 'X' and/or 'Y' regions as well. (See Trellis Chart (Grid) for more information.)...

How to Make a Web Chart - StaticColorFrame The StaticColorFrame object contains a color frame defined by explicit color data in the VisualFrame.setField(field) column, or by the fixed color in StaticColorFrame.setColor(value), StaticColorFrame.color. To create a StaticColorFrame object, call the StaticColorFrame constructor. StaticColorFrame.setColor(value), StaticColorFrame.color Specifies the static color to be used for positive field values. The static color can also be passed as an input to the constructor. If the data column specified by the inherited VisualFrame.setField(field) property contains (positive) numbers or colors, these data values are used instead of StaticColorFrame.setColor(). Bind a bar-type chart to the sample 'All Sales' query, with 'Company' (top 5) on the X-axis, and Sum(Total) on the Y-axis. Add the following script in the onLoad Handler. StaticColorFrame.setNegativeColor(value), StaticColorFrame.negativeColor Specifies the static color to be used for negative field values. If a value is specified for StaticColorFrame.setNegativeColor(), then...
How to Make an Interval Chart in InetSoft - This page will discuss the different kinds of Interval Charts, show you how to create them in InetSoft, and provide access to a free online tool for creating Interval Charts as well as complete functioning business intelligence dashboards..
How to Sort Data in Charts and Tables - Sorting data with a click of the mouse is one of the easiest ways to explore data. The following sections explain how to sort data in a table and a chart. NOTE: This feature is available both to designers and end-users. To sort a table column or crosstab column, hover the mouse over the right side of header or data cell and press the 'Sort' button. Press the button once to sort in ascending (alphabetical) order. Press the button a second time to sort in descending (reverse-alphabetical) order. Press the button a third time to restore the original order. For a crosstab, hover the mouse over a cell to display the current sort order for the field. An up-arrow means "ascending". A down-arrow means "descending". An up-arrow or down-arrow accompanied by a sigma indicates that the field is sorted by aggregate value. For example, if you sort an aggregated field in ascending order, the sort indicator for the dimension shows that it is sorted in ascending order by the aggregate value. (See Add a Table or Crosstab for more information about setting sorting in a crosstab.) To sort chart groups based on a measure, hover the mouse over the desired measure axis. This displays the 'Sort' button next to the axis. Press the button once to sort the groups in ascending order by measure value, press a second time to sort in descending order by measure value, and press a third time to restore the original order...
Impactful Unstructured Data Analysis - Using data visualization in an organization to monitor progress makes a big impact on unstructured data analysis. They picked up on this and started responding to the Twitter feeds about coming over to their store to actually acquire those same goods that were out of stock in the first one. They were also suggesting other products that they may buy. I mean this is sentiment analysis. There was a lot of negative sentiment against this one store or one chain, and it came back, and it's not something that really comes up in metrics. It's Big Data. It's unstructured data. It's Twitter feeds. It's real time data, and they are making decisions for the customer, and that pulls revenue back to the second chain, and it was measurable revenue. That’s the kind of impactful decision making that can go on when I can actually visually start to look at the impact of what unstructured data means to my bottom line...
Improving the Readability of a Chart - We have improved the readability of the chart. It is easier, but it's still difficult to know exactly what the number is, especially if you are looking for precision. Also it is a bit of a chore to go back between the legend and the pie slices and figure it out, which one corresponds to which. So on the left hand side is definitely the bad example. The right hand side version is better, but instead what you can do is, you can simply do this. Add this bar chart, and it is interesting how much this change can improve your ability to consume the data. It may be a lot less flashy, but it's a lot more useful. It shows the data, and do not distort it. Now, choosing the right type of visualization for data is a whole presentation on its own, but another small tip would be again on pie charts. Pie charts are known to be bad visualizations from the data visualization best practices point of view. There are a lot of cases where they don't work. Without going on about this, probably other chart types can work better. We love those because we typically like circular shapes, and it's pleasing to the eye, but it can make that task of seeing the data and understanding it quite difficult...
InetSoft Style Intelligence vs BOARD - Choosing the right solution for business intelligence and automated reporting can be daunting. InetSoft and BOARD are two organizations which give robust business intelligence software for organizations to improve their operations. In a recent match up compiled by user review aggregator G2 Crowd, InetSoft won higher ratings than BOARD in 6 out of 7 general categories..
InetSoft StyleBI vs Chartio - Looking to see how InetSoft's solution stacks up against Chartio? Peer-to-peer business solutions review platform G2 Crowd has released its ratings of data visualization providers and InetSoft has scored impressively, dominating Chartio in self service, the strength of its platform, and in building reports...

InetSoft StyleBI vs Google Charts - How does InetSoft compare to Google Charts? Business software comparison site G2 Crowd weighed in and showed that InetSoft beat Google Charts hands down by 86% of user ratings. G2 is known for its unbiased platform where real certified reviewers share their feedback. These reviews are weighed against data from web traffic including LinkedIn, Twitter and other social media platforms...
InetSoft StyleBI vs Klipfolio - When deciding which Business Intelligence (BI) software is best, the choice may be rather difficult, especially with so many options. In addition to experts and thought leaders in the field, reading reviews written by everyday users of a particular BI platform is a great way to help narrow the decision. When recently placed head to head in ratings by research firm G2 Crowd, InetSoft outranked BI provider Klipfolio in a majority of categories. Following is a breakdown of the various categories in which InetSoft outranked Klipfolio...
InetSoft StyleBI vs Logi-INFOWhen choosing which software is best to use in a business, the decision might be fairly troublesome. Here, there are two organizations, InetSoft and Logi-INFO, which give compelling computer software for customers to use. The organization that scored better, had a higher rating, and furthermore won a dominant part of classifications is Inetsoft. Furthermore, InetSoft prevailed upon 85% of individual evaluations...
InetSoft vs Periscope Data Comparison - When deciding which Business Intelligence (BI) software is best, the choice may be rather difficult, especially with so many options. In addition to experts and thought leaders in the field, reading reviews written by everyday users of a particular BI platform is a great way to help narrow the decision. When recently placed head to head in ratings by research firm G2 Crowd, InetSoft outranked BI provider Periscope Data in a majority of categories. This page will provide a breakdown of the various categories in which InetSoft outranked Periscope Data...

InetSoft vs Qlikview Comparison - Selecting Business Intelligence (BI) solutions for an organization is hard, risky, and inherently biased. But the process is made easier by the G2 Crowd review platform with its real-time, transparent and unbiased user reviews. This helps an organization to objectively assess what is best by leveraging the wisdom of the crowd, limiting the risk, and finding out what works. The reviews are validated by G2 Crowd thereby helping organizations make better buying decisions...
InetSoft vs Syncfusion Dashboard Platform Comparison - Selecting Business Intelligence (BI) solutions for any organization is hard, risky, and inherently biased. It is made easy by the G2 Crowd review platform with its real-time, transparent and unbiased user reviews. This helps an organization to objectively assess what is best by leveraging the wisdom of the crowd, limiting the risk, and finding out what works. The reviews are validated by G2 Crowd thereby helping organizations make better buying decisions...
In-Memory Beneficial Effects on Visualization - InetSoft's BI software employs a combination of in-memory database technology and disk-based access to scale up for big data applications using commodity-priced servers. InetSoft's proprietary term for this approach is 'Data Grid Cache.' Optimized, compressed indexes are loaded into memory while the data can either remain on the hard disk or be loaded in chunks into memory based on available memory and the data needed for a given dashboard or visualization. The data can either be accessed in real-time from a data warehouse, operational data store, or a mashup of several sources, or it can be configured to be cached on disk by InetSoft's Style Intelligence server application at specified time intervals. Incremental updates can be added on a scheduled basis or on demand, and cache re-writes can be scheduled for off-peak times...

Introducing the Sparkline Chart Type - We're looking to add context to a lot of subjects. But do we actually need that type of precision to list all the data points? Do we need the values for all these 8 points, or is there a better way to quickly get that general sense of what happened in the last 12 weeks. So what we do here, is we introduce what we call sparkline charts. These are basically just multiple miniature line charts. They allow us to show different lines for every agent, so there is no need for legends. As you can see, there's no labels on those. If you want, you can configure it, so that you can click on the sparkline, and then you can pop up a bigger line with all the values or you can may be drill through to another report. Basically, do whatever you want to, to get that specific detail, but in this case, the simple sparkline gives us a lot more insight and help us to overcome those kneejerk reactions. So you can see here that Heidi, for example, her value of 73 has actually been a pretty good value looking at her previous weeks, where she has actually consistently been improving in the last few weeks. So basically in the last five weeks, her trend is going upwards. So definitely the sparkline chart type helps us elevate the discussion that we have around the data, and this is just one example of how using context can make your data much more useful and actionable...
JavaScript Chart Scripting Techniques - The following appendices discuss general JavaScript functions and chart scripting techniques that are useful across multiple StyleBI products. JavaScript is an object-oriented programming language for performing computations and manipulating computational objects within a host environment. An object is a collection of properties and functions. A property can be a primitive type, a host object type, or a Java object. The primitive types are standard in every JavaScript runtime and are independent of the host environment. These primitive object types include the following: • Global Object Functions • String Object Functions • Number Object Functions • Date Object Functions • Array Object Functions • Math Object Functions • Regular Expression Object Functions In addition to the primitive types, this Appendix describes a number of other functions and JavaScript constructs. Some of these functions require knowledge of JavaScript arrays. See Array Object Functions for information on how to use arrays. Columns within a table or Data Worksheet can also be treated as arrays...

Key Metrics for IT Managers - In these cubes, you can do things such as get one for performance counters or state information. And once you have got your information in the cubes, then it’s really quite easy to light up the rest of the data for the BI application to see. So what we have done is shown you how to then in Style Intelligence, connect through to these cubes to build out dashboards, scorecards and the analytic components so that you can do things such as locate your data and trend it. You can pull information together from multiple instances of the systems center, which a lot of IT pros like to be able to do to do. They want to be able to get a holistic view of their entire systems and pull that information together in a sandbox environment as well as do some root cause analysis to understand whether some of your metrics might be tracking off. We have also written a whitepaper that shows you how to do some of the trickier bits. We have packaged up some samples as well. We have packaged up integration services and ETL packages which extract information right from your systems center data warehouse and then create the BI data warehouse. We have packaged up the cubes and we have packaged up some of these sample dashboards as well to kind of really accelerate things and get you going if you want to layer this business intelligence on top of systems center...
KPI Charts for Budgeting - Budgeting can be difficult for owners of small businesses. Unknown values complicate financial planning, and corporate budgeting might appear to be a time-consuming, complicated, and constraining procedure. In fact, half of small businesses avoided creating a budget, deeming it unnecessary. Despite this, firms who do not have a budget miss out on important opportunities to make economic choices that will have the greatest influence on their long-term profitability. A budget shows you if your company is headed in the right direction and whether you're on pace to meet your yearly financial goals. It does not have to be an entirely rigid construction. Instead, it might enable you to distribute resources to the greatest benefit of your company while preserving cash flow. A budget, at its core, will inform you how much cash you have and how to spend it wisely...
Learning to Effectively Use Data Visualization - How can you use data visualization to your advantage? Knowing how to use data visualization effectively can only produce the best results. It actually comes to my third point about collaboration. So now you take this, and a couple of examples. We have an account where one of the managers was in a board meeting recently and had a bunch of different business trends up on a visual dashboard on the overhead projector. So the board can visually see the stories and patterns in a way that would be hard in their old binder books. But then they can ask questions and on-the-fly, in the meeting, the manager can click on things, the entire thing updates, and so they have this engaged drilldown discussion about why has this thing gone up like this. It’s unexpected. Okay this went up. Why did that go up? And this whole thought thread gets followed. And the board ends up with a much deeper understanding. The management team gets feedback. And before all this technology, that would have been a question out of the binder which would have gone back, somebody would have done something with the data, researched it and come back with an answer a week or two later. By then the board’s forgotten the question, and it's just moved on. So this coming together has just enabled these really fast collaborative facts-based decisions like that that just are incredibly powerful for an organization to be able to do...
Making Charts in JavaScript - RectCoord The RectCoord object contains rectangular coordinates against which data can be represented. To create a RectCoord object, pass a pair of Scale objects to the RectCoord constructor: var rect = new RectCoord(xscale,yscale); You can pass a set of Scale objects (e.g., 'xscale', 'yscale', etc.) to the constructor, or specify this later using the RectCoord.setXScale(scale) and RectCoord.setYScale(scale) properties. RectCoord.setYScale(scale) Specifies the scale for the Y-axis. This can also be specified as an argument to the constructor. RectCoord.setYScale2(scale) Specifies the scale for the secondary (right-side) Y-axis...

Mapping Between Axis Values - AxisSpec.setTextFrame(frame) specifies a mapping between axis values and replacement text. AxisSpec.setTextSpec(spec) Specifies the display of axis text. AxisSpec.setTickVisible(boolean) Specifies whether the axis tick marks are visible or hidden. The GraphElement object contains the visual elements that represent data. For example, PointElement is a GraphElement that represents data tuples as points. Add a dimension to a GraphElement object. A dimension is plotted on the X-axis, or on the outer coordinates of nested coordinates...
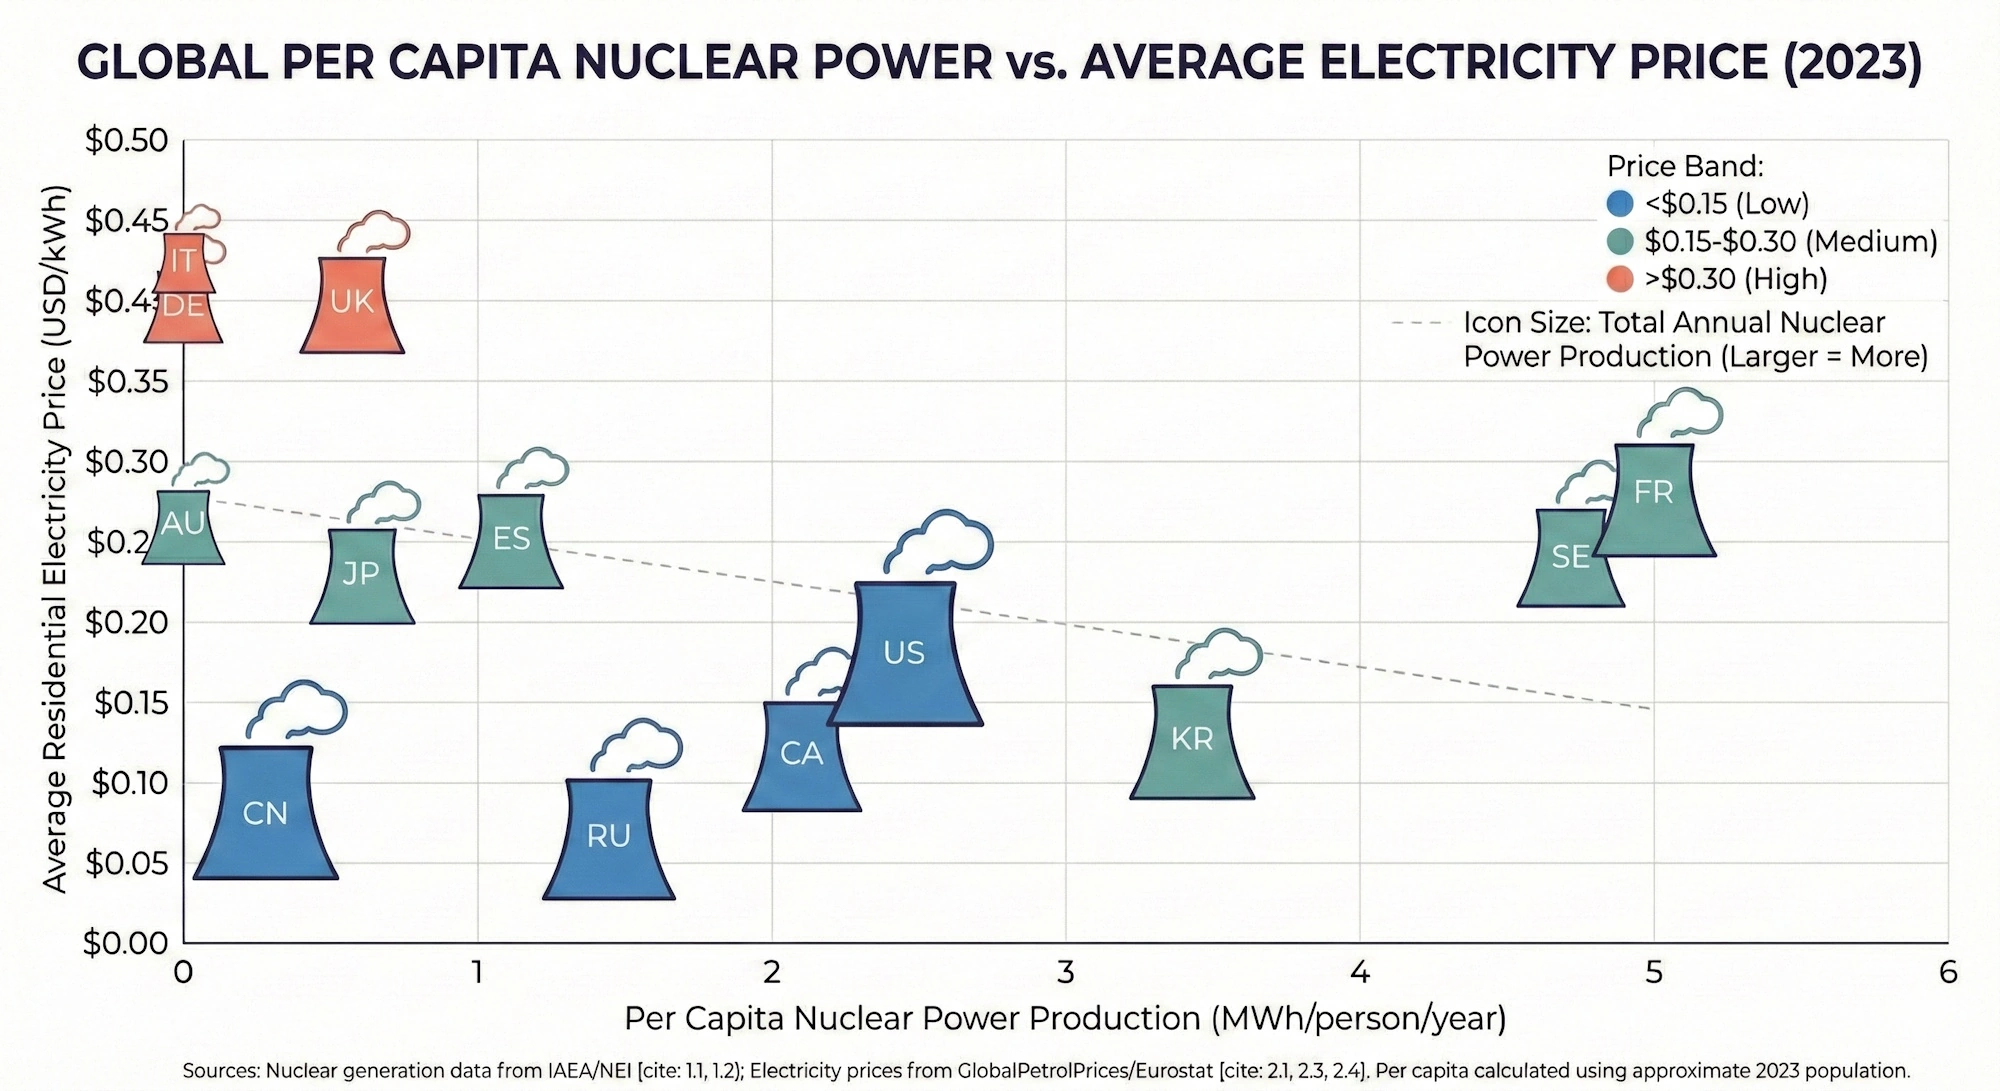
Multidimensional Chart - You can create a basic two-dimensional representation of data with just a GraphElement object. To represent additional dimensions by using other visual attributes of elements, create a VisualFrame. This creates a basic point (scatter) chart displaying the dimensions 'State' and 'Quantity'. If you want to additionally represent the dimension 'Total' with the element size, use a VisualFrame such as the LinearSizeFrame. Follow these steps: 1. Create a new LinearSizeFrame object, and specify the field containing the data that will determine the element sizes. A VisualFrame object such as LinearSizeFrame contains a mapping between data values and physical attributes. Therefore, you need a Scale to specify the mapping's scaling. The point sizes now represent the data values contained in the 'Total' field. The complete script is shown below...
Network Charts Definition - This document will discuss the uses of Network Charts, show you how to create them in InetSoft, and provide access to a free online tool for creating Network Charts as well as complete functioning business intelligence dashboards. A Network Chart is any graphical display of a network topology, representing a set of items defined by peer relationships. For each pair of items, if a relationship exists between the two, the items are connected by a line on the chart; otherwise, they remain unconnected. The nature of the peer relationship depends on the application; it may represent social connectivity (social network), financial connectivity (financial network), or any other domain where patterns of peer relationships are significant. A Network Chart differs from a Tree Chart in that relationships are not strictly hierarchical; the items or "nodes" in a Network Chart need not be "parents" or "children" of one another. A traditional sample data set for a social network is the "Southern Women" data. This data set records meetings between 18 different women at different social events over a nine-month period around 1950. More details about the data can be found at https://networkdata.ics.uci.edu/netdata/html/davis.html. The chart below uses the width of the connecting lines to signify the number of interactions between each pair of women, and connects only women who had three or more mutual interactions...
OEM Charts - InetSoft provides an interactive reporting application that is well-suited for another ISV or SaaS provider to use for embedding charts and reports into their own applications. The charting engine provides production, interactive, and ad hoc reports in a zero client, Web-based environment. Furthermore, the application's small footprint, 100% Java, pure Web architecture delivers an embedding and integration-ready platform...