Searching For Easy to Use Data Analysis Tools?


How to Sort Data in Charts and Tables
Sorting data with a click of the mouse is one of the easiest ways to explore data. The following sections explain how to sort data in a table and a chart. NOTE: This feature is available both to designers and end-users.
To sort a table column or crosstab column, hover the mouse over the right side of header or data cell and press the 'Sort' button.
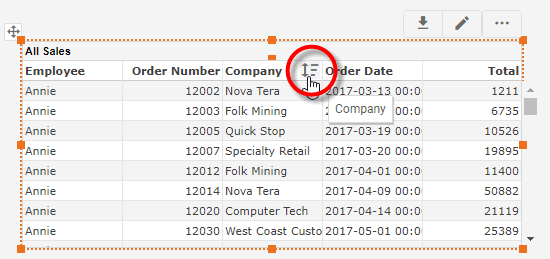
Press the button once to sort in ascending (alphabetical) order. Press the button a second time to sort in descending (reverse-alphabetical) order. Press the button a third time to restore the original order.
For a crosstab, hover the mouse over a cell to display the current sort order for the field. An up-arrow means "ascending". A down-arrow means "descending". An up-arrow or down-arrow accompanied by a sigma indicates that the field is sorted by aggregate value. For example, if you sort an aggregated field in ascending order, the sort indicator for the dimension shows that it is sorted in ascending order by the aggregate value. (See Add a Table or Crosstab for more information about setting sorting in a crosstab.)
To sort chart groups based on a measure, hover the mouse over the desired measure axis. This displays the 'Sort' button next to the axis. Press the button once to sort the groups in ascending order by measure value, press a second time to sort in descending order by measure value, and press a third time to restore the original order.
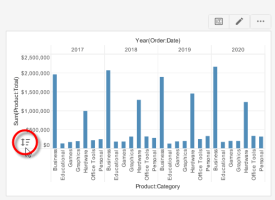
When multiple dimensions are represented on the chart (as in the image above), the 'Sort' button operates on the innermost dimension.

More Articles About Data Analysis
15 KPIs for the Insurance Industry - Key Performance Indicators (KPIs) are used to measure the performance and efficiency of an insurance company. The information from KPIs is invaluable in assisting insurance companies to identify areas they succeed in and areas that require more work, focus, and resources. The most common KPIs include. Quote Rate Quote rates are fundamental in an industry where speed and exceptional service can make or break the business. A quote is usually a potential client's first interaction with an insurance company, so it must be accurate and sent timeously. A quote rate looks at how many quotes an insurance broker compiled and supplied compared to the number of leads they contacted...
Analytic Tools for Government Decision-making - It's driving a lot of decisions that the government has to make, hard decisions. And we want to make sure they are the right decisions because they are going to impact our future. We are also working with a lot of states who are working on tax compliance solutions. For instance, I read where over the past fifteen years a combination of five states were able to collect $1.5B more because of good analytics...
Analytical Tools with Ad Hoc Editing - InetSoft's interactive dashboards provide the user with a visual representation of analysis. By visually interpreting the data the user can then see possibilities they couldn't before. The dashboard can be manipulated to show only certain data points, isolating one single variable and seeing how it affects the group as a whole. For instance, the pencil tool can be used to change the dimensions and measurements of the chart as well as what data is actually being shown and how that data is shown visually. The user also has the option of changing the shape, size, color, and text to their own specifications...
Benefits of InetSoft's Report Tool - InetSoft's reporting tools allow users to gain a deeper understanding of where their business stands day-to-day and long-term. Because the tool is so powerful and intuitive, all users can quickly create dynamic reports that rapidly flow throughout the organization so that all levels are on the same page. In turn, each level of the organization can become more efficient in their sectors and the overall business can flourish more seamlessly...

Data Analysis and Data Reporting Defined - Data analysis is the process of evaluating data and drawing conclusions. Data analysis is standard for any business, but it's important that it's done correctly so that internal issues can be identified and quickly resolved. This is where data reporting is useful. Data reporting is the process of collecting data and manipulating it to make it clearer for the audience that is analyzing it. Data reporting is an essential aspect of data analysis...
Data Mashup Platform with Analytics - This is a table of contents of useful information about the data mashup platform that is included in InetSoft's business intelligence software for dashboards, reporting, and analytics, Style Intelligence. Refreshing the view, instantiating data into the view, it was kind of slow. Thank God these kind of speed bottlenecks have been cleared as...
Easier Machine Learning Technology - Evaluating machine learning technology options? InetSoft is an industry pioneer providing easier, more cost-effective business software solutions. Request a personalized demo. Machine Learning Dashboard to Predict Customer Churn - Looking for a hands-on example of how machine learning dashboards can be integrated with interactive visualizations? Click on the customer churn dashboard below to watch its machine learning algorithm adjust its predictions in real time. (click filters on the dashboard and then click "train ML model")...
Evaluate InetSoft's Data Visualization Dashboard Software - Looking for good data visualization dashboard software? InetSoft's pioneering dashboard reporting application produces great-looking web-based dashboards with an easy-to-use drag-and-drop designer. View a demo and try interactive examples. What's the biggest problem with data? It's trying to understand it once you capture it, trying to present that back in a meaningful way. Trying to curate it...

Examples of Demographic Analysis - If you are looking for some ideas on how to analyze demographic data, take a little time to examine these demographic dashboard examples. Data can be explored using a wide range of built-in functions as are detailed in the different sections (with screenshots) below. The more you experiment with this demographic dashboard example, the more you will see how a well-designed dashboard with powerful interactive features can analyze data effortlessly...
Free Business Dashboard Evaluation - Evaluating dashboard solutions for your organization's internal use or to embed in a commercial application? Deploy a small-footprint, easy-to-use Web-based data dashboard application from InetSoft. As an innovator in reporting software since 1996, InetSoft has pioneered the evolution from static reporting towards interactive visualization of data via dashboards...
Information About Data Analytic Software - Looking for data analytic software? InetSoft offers a Web-based BI platform that can includes easy to use visual analysis tools and is quick to deploy. View a demo. Read customer reviews. One to two-day training is a lot better than six-week training. Talk about models and scoring models and managing different models over time. A lot of these data mining applications can be set up such that the scoring is done automatically. In other words when you apply this algorithm for "next best offer" that sales increase 2.1%, for example, whereas that other model, sales actually decreased to 0.2% or 0.7% or something like that...
Invaluable Role of Machine Learning - In the Age of Information, having access to data alone will not propel your business forward. To evolve your business and gain a sustainable edge on the competition, squeezing every last drop of value from your organization's data is essential. Modern BI software provides a powerful outlet for cleaning, curating, and visualizing data. Coupled with machine learning (ML) technology, it can help business users uncover a layer of insight often overlooked by even the most experienced analysts...

Gallery of Data Analytics Software Samples - Searching for the best data analytics software samples? InetSoft provides examples from its highly-rated, easy to use dashboard analytics software. This revenue analytics sample breaks down revenue by plan type, state, and date. A dropdown selector changes fields displayed in the bar chart, helping to cut down on the overall number of elements in the dashboard...
Good Data Discovery Software Vendor - Looking for data discovery software vendors? Since 1996 InetSoft has been a BI application innovator and its Web-based visualization solution is quickly deployed and easily used. View a demo. Review the resources and articles below for more information. Using data visualization in an organization to monitor progress makes a big impact on unstructured data analysis. They picked up on this and started responding to the Twitter feeds about coming over to their store to actually acquire those same goods that were out of stock in the first one. They were also suggesting other products that they may buy...
Program to Help You Visualize - Are you looking for a data analysis program to help you visualize and analyze data, answer business queries, and increase overall project efficiency? Since 1996 InetSoft has been making BI software that is easy to setup and easy to use, allowing users to build self-service oriented dashboards and visual analyses quickly. In the modern-day world of data analytics, the application of data analysis software has become a must to meet the increasing demand of business questions and constantly changing data. While there are a variety of companies offer some type of data...

Pioneering Business Insights Tool - Looking for a good business insights tool? InetSoft's pioneering dashboard reporting application produces great-looking web-based dashboards with an easy-to-use drag-and-drop designer. The built-in interactivity of the dashboards enables self-service analytics to answer almost any question and help find insights into business performance. View a demo and try interactive examples. This is all automated in multiple systems so they can monitor just the lowest level of detail such as an action that took place on the SAP system...
Reports Can Be Adjusted - In today's business climate, business questions are changing on a near daily basis. With StyleBI, dashboards and reports can be adjusted and changed easily, without help from IT. This flexibility enables your organization to keep up with constant change...
Sophisticated Visualization Environment - InetSoft's StyleBI offers sophisticated software for database visualization. StyleBI is a small-footprint Java-based business intelligence software that maximizes self-service. It is unified, easy-to-deploy, and easy-to-use. Database visualization is most effective when it is purposeful, simple for all end-users, and when data can be "sliced and diced" for deep analysis to generate the best possible business strategies...
Tools That Are Very Analytical - Often tools that are very analytical have a lot of interactivity, visualization and navigation. That's a big requirement for many users who need to interact with data using a GUI or some sort of interface that allows them to explore and identify trends. One of the most common things that we see is that data analysis tools are usually used by a select few people. Over time we are starting to see that trend slowly change where more people in a company can and do use these OLAP tools, but for the most part we're still seeing specific roles in an organization that have specific needs with regards to data analysis...

Useful Information About Analytics - This is a table of contents of useful product information about, and benefits of, InetSoft's analytics capabilities built into its business intelligence software for dashboards, reporting, and mashups. Today we are going to talk about business analytics. I want to start by referring to a man named Thomas Davenport who has written a book, Competing on Analytics, which is based on a study of companies using analytics. Among the findings he reports in the book, he discovered that the top performing organizations are 50% more likely to utilize information strategically or analytical information strategically. There are a couple of levels of strategic analysis that he is referring to...
Visualization Dashboards for the Construction Industry - InetSoft provides a comprehensive data analytics tool for all construction analytics and reporting requirements of executives and stakeholders alike. Flexibly-priced and easier to deploy and administer than traditional business intelligence solutions, InetSoft's Java-based, zero-client application makes an attractive option for evaluation...