InetSoft's Data Analysis Program
Are you looking for a data analysis program to help you visualize and analyze data, answer business queries, and increase overall project efficiency? Since 1996 InetSoft has been making BI software that is easy to setup and easy to use, allowing users to build self-service oriented dashboards and visual analyses quickly.
In the modern-day world of data analytics, the application of data analysis software has become a must to meet the increasing demand of business questions and constantly changing data. While there are a variety of companies offer some type of data analysis program, there are not many that offer users the ability to create powerful visualizations and reports with no IT experience needed.
Maximum Self-Service in Data Analysis
InetSoft's data analysis program was created so that users can have maximum self-service and flexibility to create dashboards and reports with virtually no limitations. Users need only a basic understanding of Excel skills in order to create professional dashboards and reports, which reduces the need to rely on IT to update and maintain data. This leads to a decrease in overhead costs as well as a decrease in the overall deployment time of the program.
Immediately after deployment of the program, users can drag and drop DataBlocks of desired data from multiple sources simultaneously onto the design grid in order to create a multitude of visualizations such as charts, tables, crosstabs, and gauges. Maximum self-service also means that easy customization for the user is the highest priority. Users are free to manipulate text, colors, dimensions, layout, and display of the dashboard with just a few simple clicks.
Program Features and Benefits
InetSoft offers many unique features to users that allow for a new level of data analysis. Users are no longer limited to already established analyses of their data, but can now spontaneously explore and manipulate the data to spot new trends and predict the success future decisions. The more ways data can be viewed, the more chances there are to answer new queries that may not have been thought of before.
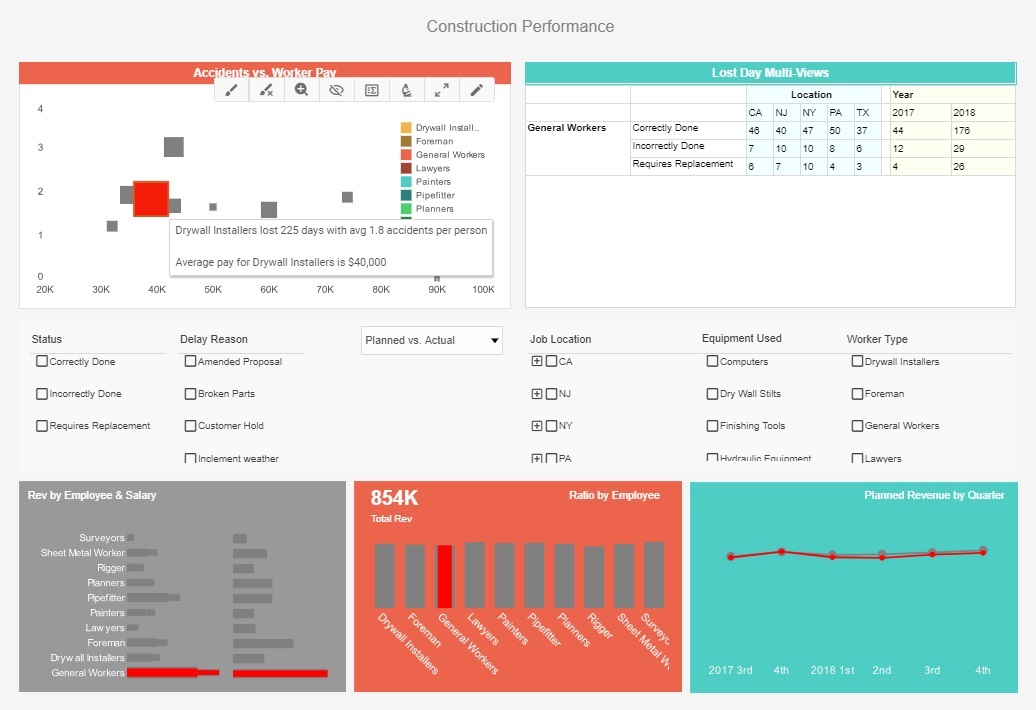
Charting FeaturesUsing multidimensional charting, users can depict more than two dimensions on a graph by simultaneously representing points through various shapes, sizes, or colors. This enables users to create 3d, 4d, or even 5d charts and spot more nuanced trends that would not be noticed on a standard two dimensional chart. In addition to this charting feature, co-located charts gives users ability to position multiple charts of various types in a shared location and quickly sort through them by clicking on the corresponding tab, thereby reducing dashboard complexity and enhancing the propensity for accurate interpretation.
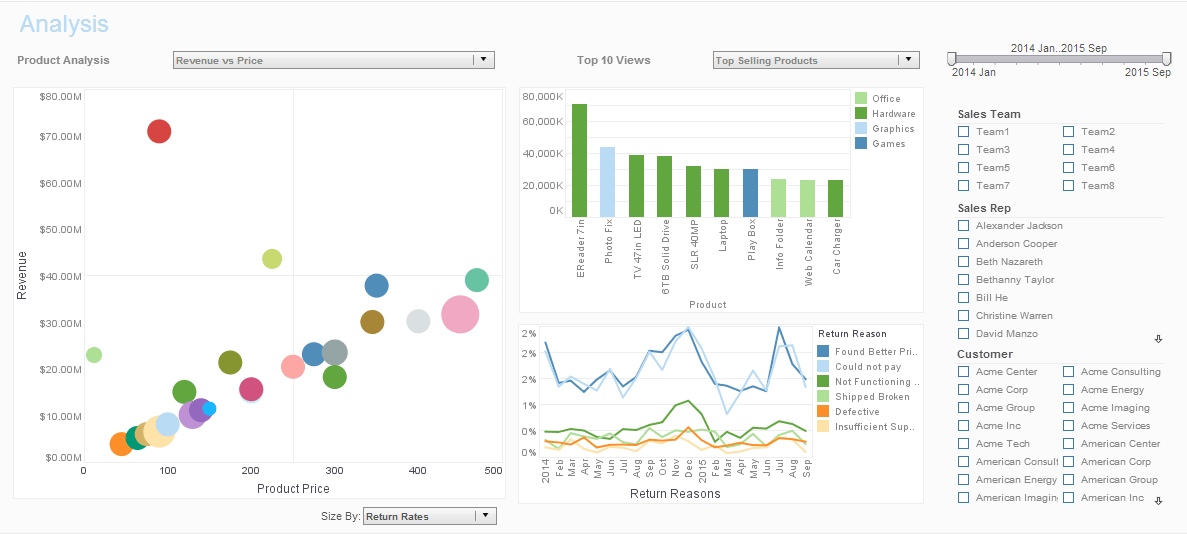
Data Drill-DownWhen it comes to drill-down of data, the brushing feature allows users to highlight data points within one chart and immediately isolate corresponding data points in accompanying charts, leading to quick comparative analysis and recognition of aberrations and outliers.
These are only a few of the many features that are offered to users to create self-service dashboards for data analysis. Interested in finding out more? Get a personalized demo of InetSoft's data analysis program today!