All the Different Ways to Analyze Data

#1 Ranking: Read how InetSoft was rated #1 for user adoption in G2's user survey-based index Read More

Key Takeaways From Data Analysis

This page willcover the definition of data analysis and also drill down into the applications of data-centric analysis. By understanding your data and making your it work for you, it's possible to transform raw data into positive actions that will take your organization to the next level. Here is a brief summary of all the different ways to analyze data and ultimately grow your business.

7 Different Ways to Analyze Data
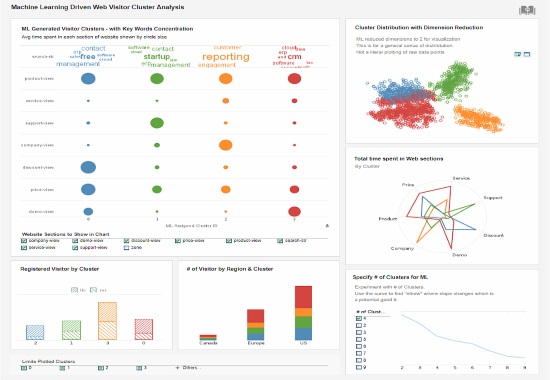
    Cluster analysis
    Cohort analysis
    Regression analysis
    Factor analysis
    Neural Networks
    Data Mining
    Text analysis


Top Data Analytics Techniques

    Collaborate to asses needs
    Establish questions
    Data democratization
    Data cleaning
    Determine KPIs
    Omit unnecessary data
    Construct a data management roadmap
    Integrate technology
    Answer questions
    Visualize the data
    Interpret the data
    Considering autonomous technology
    Build a narrative
    Sharing the load
    Robust Analytics tools
demo icon
View a 2-minute demonstration of InetSoft's easy, agile, and robust BI software.

We are living in a time of ubiquitous data. These days, you can't run a business without some knowledge and understanding of data analysis.

From global multinationals to small businesses, every kind of organization has data that at a minimum needs to be monitored, and in many cases analyzed thoroughly, to ensure that affairs are managed properly.

Having the knowledge of how to properly analyze and glean insights from your organization's data is more important than ever, and can make or break you relative to competitors.

But while everyone has data, most are barely scraping by when it comes to making use of it. If you feel that you're not doing all that you can with your data, you're not alone. Most managers and business users know that greater direction could be gleaned from company data, but don't know to do so.

Data Analysis and Data Reporting Defined

Data analysis is the process of evaluating data and drawing conclusions. Data analysis is standard for any business, but it's important that it's done correctly so that internal issues can be identified and quickly resolved.

This is where data reporting is useful. Data reporting is the process of collecting data and manipulating it to make it clearer for the audience that is analyzing it. Data reporting is an essential aspect of data analysis.

To understand the distinction better, see this page on data analysis reporting.


gallery
View the gallery of examples of dashboards and visualizations.

Two Kinds of Data Analysis Tools

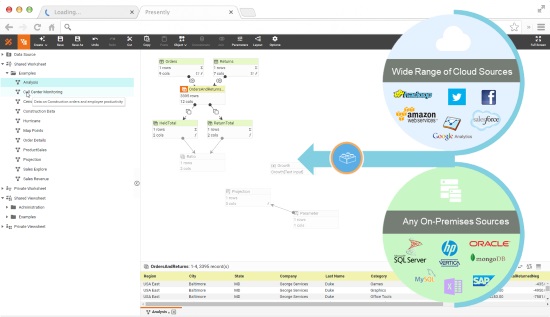
While there is a large selection of data analysis technologies available, these tools can be separated into two fundamental categories: ones based on hardware architecture, and ones based on software architecture. Hardware solutions are disk-based, whereas software solutions are memory-based. One type is not better or worse, as it depends on your organizations requirements. There are also hybrid solutions which combine both of these techniques.

A disk-based solution is usually much more powerful, and is used with a large data profile, involving terabytes of raw data, and the need for aggregation to take advantage of cubes and summarization. In most cases the disk based solution requires some kind of data modeling, so that you can summarize and create aggregations. The downside of disk-based solutions are a lack of flexibility in analysis and aggregation.. Disk based solutions are typically powered by an OLAP engine.

In an in memory-based environment, data access is much faster, because the information is cached and available through a fast I/O exchange, which offers a very fast, speed-of-thought, kind of interactivity with the data. However, in-memory only solutions are often limited to department-sized datasets of up to a terabyte. For this reason, they are insufficient for a large scale enterprise analytical environment.

In-memory data modeling can be done via a graphical user interface on the fly, whereas with a disk-based solution tends to require more data summarization to make the environment work properly.

Another feature of some in-memory solutions is associative indexing done at the user level, allowing you to assign a relationship between tables with a drag and drop tool, pulling data from relational or non-relational data sources, including flat files, spreadsheets, or almost any type of data source.

This is another common advantage of an in-memory BI solution. Read more about types of data analysis technologies here.

Read more about InetSoft's in-memory database technology to learn how it works and what its advantages are over a pure in-memory solution.


The Impact of Data Analysis

Analyzing data can make a huge difference for your organization. It used to be the case that only businesses with large inventories or many employees would have enough data to require data analysis tools. But these days with so much more business functions done in the business space, such as accounting, payroll, web analytics, and budgeting, even small business owners have large volumes of data that can be leveraged for better management decisions.

As every business has a website, web analytics data can help you understand your potential customers better, by showing you which types of pages are more compelling, and what kinds of materials will bring them to and keep them on the site.

Customers are the most important element in any business. By using data analytics to get a new perspective on your customers, you can better understand their demographics, habits, purchasing behaviors, and interests.

In the long run, adopting an effective analytics strategy will increase the success of marketing, helping you target new potential customers, and also avoid targeting the wrong audience with the wrong message. Customer satisfaction can also be tracked by analyzing reviews and customer service performance.

Managers can also benefit from data analysis, as it encourages business decisions to be made on facts and not simple intuition. With analytics, you can understand where to invest your capital, detect growth opportunities, predict your incomes, and tackle uncommon situations before they become problems. Data from your payroll can help you understand what has the biggest cost impact on your business and help you evaluate which departments produce the biggest return on your investment.

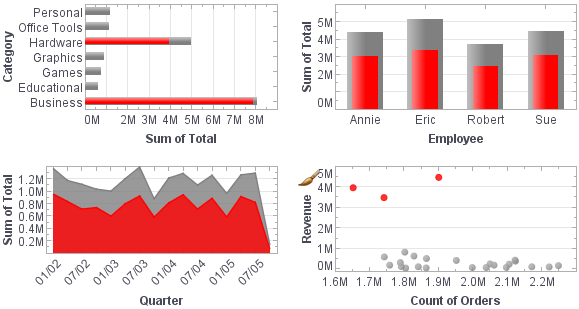
These are just a few examples of how relevant information can be gained from data analysis performed in all areas in your organization. With the aid of an effective dashboard software, you can present these data insights in a professional and interactive way.


Read the Style Intelligence datasheet for a detailed explanation of the platform's capabilities and features.

Types of Analytics


Before going into the different ways of analyzing data, it is important to understand the fundamental types of analytics. The most common types are descriptive and prescriptive, but there are other categories as well.

As more varieties of data analysis are understood, more value and actionable insights are brought to an organization.

Descriptive Analytics

Describing the past

Descriptive analytics is where any analysis of data begins, with the use of data to describe what has already happened. This is done by ordering, manipulating, and interpreting data, possibly from a plethora of different sources, to glean a valuable understanding of what has been going on in an organization.

Descriptive analytics are essential for the meaningful presentation of data. And although descriptive analytics do not predict future outcomes or explore causes, they lay the groundwork for these more advanced types of analysis.


Exploratory Analytics

Exploring data relationships

Exploratory analytics explore the relationship between data and variables. Exploratory analytics uncovers connections, helping you generate hypotheses and begin solving problems. Data mining is a common application of exploratory analytics.

Learn the advantages of InetSoft's small footprint BI platform.

Diagnostic Analytics

Exploring causes

Diagnostic analysis is one of the most powerful kinds of analytics. This kind of analysis goes beyond simple description to provide understanding as to why and how things happened the way that they did. This kind of understanding is often the primary goal of an organizations analytics strategy and its value cannot be understated.

Diagnostic analytics provide actionable insights in response to specific business questions. It is the foremost style of analytics used in scientific research, and is also a vital aspect of analytics in retail.


Predictive Analytics

Deducing future performance

Predictive analytics attempts to look into the future and predict what will happen. It does this by building on descriptive, exploratory, and diagnostic analytics, as well as artificial intelligence and machine learning algorithms. When used properly, predictive analytics can predict future trends, as well as give advanced warnings on problems and future inefficiencies, helping to prevent losses before they happen.

Effective predictive analytics lead to organizational changes that not only streamline operations but also keep ahead of competitors. Doing descriptive and diagnostic analytics properly is essential for predictive analytics, as understanding of what has happened and why is necessary to properly predict how business conditions will unfold.


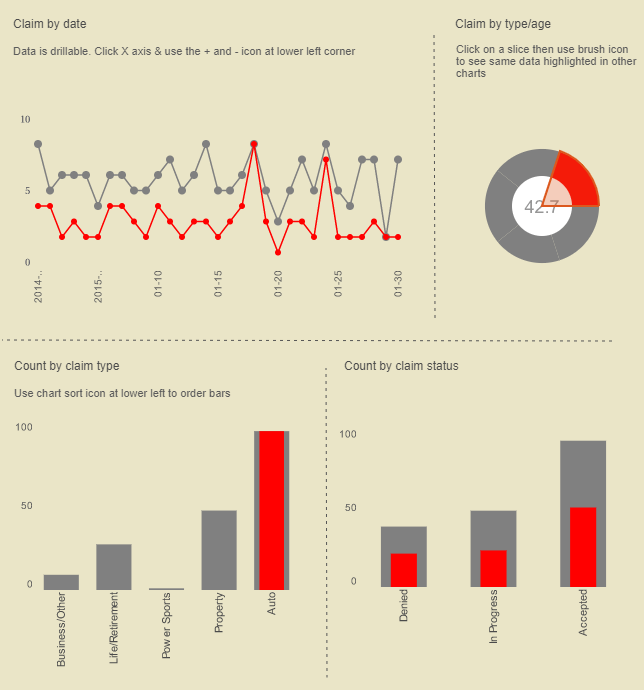
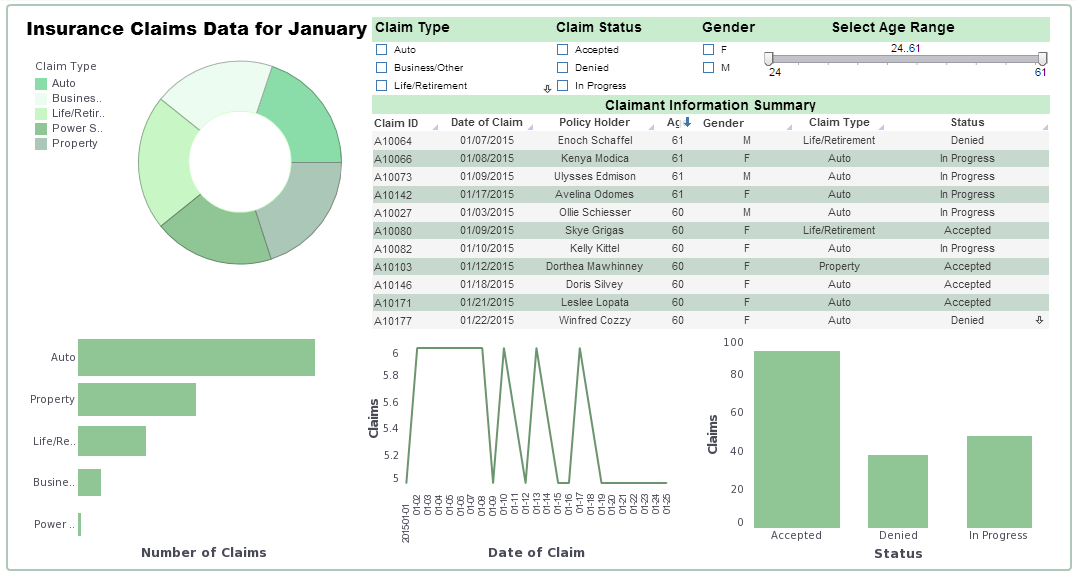
One example of predictive analytics at work is in detecting fraudulent insurance claims, which are disturbingly common. Fortunately predictive analytics can predict a customer's propensity to take a particular type of behavior during, the underwriting process. Ultimately of course, the customer's behavior may be based on the context of the situation. Maybe their financial need might change between the point of buying a policy and submitting the claim, for example.

view demo icon
View a 2-minute demonstration of InetSoft's easy, agile, and robust BI software.

Market conditions might change in the performance of the insurer at the point of claim and might influence how the customer penalizes the insurance company. For example, if an insurance company performs particularly badly at the point of claim., then the customer may well penalize them in some way.

Very interesting metrics are emerging. It is important also that we take into account the policy position. For example, if a customer was declined coverage on the basis of something they may or may not do, then they have an obligation to declare that insurance had been declined to all future insurers.

Fraud analytics help predict policy holder fraud, but there are also quite big issues around supplier fraud, which is generally referred to as claims leakages. Predictive analytics has a major part to play in how companies manage their supply chain and optimize it, ensuring insurers pay no more than the absolute requirement.

Predictive analytics can guess these outputs that are being generated either around historical data or the actual data that is being given to the call center agent. The technology guess these outputs back to the agent in real time to make a difference at that inflection point based on APIs integrated within their system to ensure that the scoring mechanisms are relayed back to the contact management system in a real time fashion. They can be generally relatively easy to develop, and it just takes the right people and the proper building blocks to be able to get the output at one end, to the presentation of those outputs and on the screen for the agent on the other end.

To learn more about how predictive analytics can be used in the insurance industry, see this article.


Prescriptive Aanalytics

Deducing future causes

Along with diagnostic analytics, prescriptive analytics is a hallmark of scientific research. Prescriptive analytics go beyond predictive analytics, to develop practical organizational strategies in response to predicted patterns and trends.

Prescriptive analytics are an essential aspect of the analytics strategies of many different types of businesses and departments, including, logistics, sales, marketing, HR, customer experience, and fulfillment finance.

Ways to Analyze Data

Below are seven different ways to analyze data, along with practical real world applications.

Cluster Analysis

To perform a cluster analysis is to group (or cluster) data elements by similarity. This aim of this method is not so much to test a variable but to uncover hidden data patterns. This provides additional context to traditional analysis.

One application of cluster analysis is in marketing. Since there are usually too many customers to analyze individually, they must group the customers into clusters based on money spent, purchasing behaviors, demographics, and other relevant factors. This enables insights to be gained about different types of customers and how a business can appeal to them and serve them better.


Read what InetSoft customers and partners have said about their selection of Style Scope for their solution for dashboard reporting.


Cohort Analysis

A cohort analysis uses historical data to compare and examine user behavior by grouping users into cohorts based on behavioral similarities. This type of analysis gives insights into customer needs and improves market segmentation targeting.

A common application of marketing cohort analyses is measuring the impact of campaigns on specific customer groups.. For example, an email campaign encouraging recipients to subscribe could be performed with two different but similar series of emails, with similar messages but different content and graphics. A cohort analysis would be used to track campaign performance and measure the effectiveness of the different types of content.

Regression Analysis


A regression analysis uses historical data to understand how one or more independent variables influence the value of a given dependent variable. This type of analysis helps users understand different variables affect each other. This is an important component of predictive analytics, since the relationships of past variables aids in the prediction of future outcomes.

One common example of a regression analysis would be the breaking down of annual sales by variables like, marketing campaigns, product quality, customer service, store design, and sales channel, to see try and determine how the aforementioned variables affected overall sales.


If any one of these variables changed from year to year (stores closed during lockdowns for example) a regression analysis could be used to measure whether it had a negative overall impact on sales, or whether the shift to online orders was enough to compensate. In this example, store closings would be the independent variable and annual sales the dependent variable.

demo
Read how InetSoft saves money and resources with deployment flexibility.

Neural Networks

Neural networks are the foundation upon which intelligent machine learning algorithms are built. They are a style of analytics that attempts to understand and mimic how the human brain processes insights and predicts values. A proper neural network will adjust its algorithms (or "learn") from every calculation it performs, so it is constantly updating and improving itself.

Neural networks are increasingly being used to power more sophisticated predictive analytics. Many BI platforms, such as InetSoft now enable the integration of neural networks with traditional data visualization.

One example is the dashboard below, which has a machine learning model which can be trained based on what filters are selected. This kind of integration brings the benefits of neural networks to the non technical user.

To learn more about neural networks, see this article by InetSoft CTO Larry Liang.

Factor Analysis

Also called "dimension reduction," factor analysis is used to investigate variability among observed, correlated variables to uncover unobserved variables called factors. Uncovering these independent latent variables, an ideal analysis method for streamlining specific data segments.

One example of the factor analysis method is a customer evaluation of a product. This initial assessment would be based on different variables like current trends, materials, comfort, color, shape, wearability, frequency of usage, and where the product was purchased. There is no limit to the variables that can be tracked. In this example, a factor analysis would be used to summarize all of aforementioned variables into homogenous groups, into a brother latent variable of design.


Data Mining

Data mining is the process of analyzing data from different perspectives and summarizing it into useful information that can be used to increase revenue and cut costs. It allows users to analyze data from a multidimensional standpoint in order to sort and summarize any relations that are derived.

Data mining can be interpreted as the process of finding correlations among a multitude of fields in large relational databases. Data mining uses exploratory statistical evaluation to pinpoint trends, relations, dependencies, and data patterns to increase understanding. A "data mining mindset" is key for getting the most out of your data.


Companies use data mining to sift through data for market research, report creation, and report analysis. Technology innovation continuously increases capacity for analysis whilst driving down costs. The associations found by running these programs can lead to the valuable revelations about company performance or behavior. Sales figures, stock numbers, shipping logs, and many other elements can tell an important story that will influence managers' future decisions.

Technological innovation continuously increases the capacity for analysis while driving down costs at the same time. Data mining software analyzes data from many different angles and compiles it into useful reports. Managers can use the information in these reports to increase their revenue and cut their costs. These applications allow users to examine data from a multidimensional standpoint in order to analyze correlations that are not immediately apparent.

Information attained this way allows for the discovery of historical patterns and trends that can help predict future performance. Data mining is used to determine relationships amongst controllable variables that enable managers to visibly view impacts of certain factors on a business. It also allows users to drill down and discover correlations in the information that makes up the data. Information attained this way reveals historical patterns and trends that help track key indicators that are integral to forthcoming operations.

One great example of data mining is InetSoft's custom notifications, which enable the user to set automatic alerts based on particular conditions being met within an interactive dashboard or report. For example, in this supply chain dashboard, the user could set an alert to trigger when supplies dip below a certain quantity. Upon seeing the alert, the user can drill down into the data to explore the root cause of the issue.

To learn more about data mining, click here.

custom notifications dashboard


Read the top 10 reasons for selecting InetSoft as your BI partner.

Text Analysis

Text analysis, or text mining, consists of taking large sets of text data and rearranging it into an easier to manage format. This intensive cleansing process enables the extraction of the most relevant data needed to steer organizational decision making.

Text mining has become a much easier process with recent developments in analytics technology. With AI an machine learning, text data can not only be mined but can also have sentiment analysis performed on it. Sentiment analysis is when these intelligent algorithms are used to understand the emotions, or sentiment, behind text, and score it based on certain relevant parameters. Sentiment analysis is crucial for the monitoring of product and brand reputation and evaluating customer experience.

An comprehensive brand management strategy will include text analysis of surveys, articles, product reviews and other sources of opinion, and use the insights gained therein to create effective marketing campaigns and also better tailor customer service.

How Is Data Analyzed? Top Analytic Techniques for Business Users

Collaborate to Assess Needs

Before the analysis of data can begin, it's best to meet and collaborate with all key stakeholders within your business to determine your primary campaign or strategic goals, thus gaining a comprehensive understanding of the types of insights that are needed to steer management directives and grow your organization.

Establish Questions

Once core objectives have been outlined, the next step is to determine what are the questions that need to be answered to meet those objectives.. This is a crucial aspect of all data analytics strategy since it shapes every aspect of your approach.

To get the right answers, you must ask the right questions.


Data Democratization

Once the proper direction for data analytics methodology has been established, and the questions for extracting optimum value has been determined, the next step is data democratization.

The goal of data democratization is connecting data from multiple sources quickly and efficiently, so that any business user in the organization can access it at any given time. Data can be extracted in a variety of formats, such as numbers, text, images, and videos. After extraction, a cross database analysis is performed to glean further insights which are then shared with the team.

Once the most valuable data sources have been selected, all of this information must be taken into a structured format in order to start collecting insights. For this purpose, InetSoft offers a variety of different custom data connectors to integrate any and all internal and external data sources and manage them easily. In addition, InetSoft's BI solution can be set to automatically update data either continuously or at pre defined intervals, according to client needs.

top ranked BI
Read how InetSoft was rated as a top BI vendor in G2 Crowd's user survey-based index.

Data Cleaning

Harvesting data from a multitude of sources leaves one with a vast amount of information that can be overwhelming. The data can often include incorrect data that can color the analysis. For these reasons, the next logical step is to clean the data. This process is an essential step to take before visualizing data, to ensure that insights extracted from the data are accurate.

There are some key things to look out for while cleaning the data. The most important thing to watch for and eliminate are duplicate observations which occur when using multiple internal and external sources of data. Other things to look out for and fix are missing codes, empty fields, and incorrectly formatted data.


One type of data that usually requires cleaning is text data. As previously mentioned, the most common text inputs used today are social media comments, customer reviews, and questionnaires. But for intelligent algorithms to detect patterns in the text, the text data needs to be cleansed of invalid characters as well as spelling and syntax errors.

Cleaning data is crucial is to prevent arriving at false conclusions that can steer an organization in the wrong direction. By making sure data is clean, it can be ensured that business intelligence tools create accurate reports for the organization.


Determine KPIs

Once data sources have been set, data has been cleaned, and clear-and detailed questions have been established, the next step is selecting a number of key performance indicators (KPIs) for the purpose of tracking, measuring and shaping progress in key areas.

KPIs are essential for performing analytics in both quantitative and qualitative research. They are an essential aspect of data analysis that cannot be overlooked.

When it comes to selecting KPIs. A middle-of-the road approach between a top-down and a bottom-up approach is recommended. When you are getting down to the departmental level, the metrics become very specific, and sometimes industry specific guidance is needed. Some industries, like government, education, and healthcare share what the standard metrics they are using are, because they're not in hyper-competitive marketplaces. For other businesses such as in financial services, finding the common industry KPIs can be a little more challenging. Sometimes a key metric can be a secret way for an industry player to track the performance of their business or their marketing campaigns, so they can be reluctant to share that knowledge or methodology.

However there have been some consortiums formed, with some websites collecting and defining industry-specific KPIs. One such website is KPI Library at http://www.kpilibrary.com/

Once you get started measuring and tracking the most obvious performance indicators, and you immerse yourself in them, begin to puzzle in your own head what else could be measured, by noticing what other event or activity might cause the indicator you're already watching to go up or down. That will lead you in the direction of other leading indicators.

A "hub and spoke" approach to performance management is recommended, as data silos are something to be avoided. When each department creates their own metrics, many of them will end up overlapping and create inconsistencies with other departments. On the other hand, any effort to completely centralize the management of metrics and all the associated governance will collapse under its own weight from too much bureaucracy and red tape.

Some kind of hub and spoke environment for performance metrics has its place. Anything that has to be managed and handled and monitored at a corporate level, anything that is mission-critical, anything that goes across the enterprise boundaries, all of this belongs in a hub.

But when it comes to metrics that no one outside of a particular product line or a particular department is ever going to look at, such as marketing campaign effectiveness metrics, those can be created those on the spokes. The back office, finance and HR departments probably don't need to know about these metrics. So its best to make your performance metrics dashboard more agile based on the breadth of the audience.

why select InetSoft
“We evaluated many reporting vendors and were most impressed at the speed with which the proof of concept could be developed. We found InetSoft to be the best option to meet our business requirements and integrate with our own technology.”
- John White, Senior Director, Information Technology at Livingston International

It is also important to clearly delineate who is responsible for each metric: IT or the business owners. High level type of metrics, like profitability or gross margin calculations, should be created, measured, and monitored by the business stakeholders. More detailed level metrics, such as customer counts, transaction volumes, might fall onto those in IT or those in middle management roles.

When it comes to managing metrics, don't try to "boil the ocean." When top management tries to define the key performance indicators for their entire enterprise, from front-office to back-office to HR, finance, sales and marketing, they usually fail. The best practice is to find the low-hanging fruit that can be implemented relatively painlessly and will achieve the biggest bang for the buck.

As an example, if your customers are leaving due to low satisfaction, then create a few metrics to monitor the reasons for customer satisfaction, the number of complaints, or response times. Implement them quickly to get the return on the investment you have made focusing on those KPIs.

Then continue to chip away at the next pain points, never trying to tackle all the KPIs at once. For further guidance, here is some advice for InetSoft experts on determining your KPIs.

Omit Unnecessary Data

Once appropriate data analysis techniques and methods have been selected, and a clear analytics strategy has been defined, the raw data collected from all sources should be explored, and use the KPIs used as a reference for removing any information that is not useful.

Removing extraneous information is essential for effective analysis since it allows users to focus their analytical efforts and extract maximum value from the remaining "lean" information.

Statistics, facts, metrics or figures that don't align with business goals or fit with overall analytics strategy can be eliminated for efficiency's sake.

Read why choosing InetSoft's cloud-flexible BI provides advantages over other BI options.

Construct a Data Management Roadmap

While it is not mandatory (following the previous steps will be enough to form a sound strategy and yield actionable insights), crafting a data governance roadmap will add an element of sustainability to data analysis methods and techniques. Properly developed data management roadmaps can be adjusted over time as needed.Taking the time to develop a roadmap helps own know ahead of time how data will be stored, managed, and handled internally. This makes analysis techniques more fluid and functional and is a key component of any analytics strategy.

Integrate Technology

There is a multitude of methods for analyzing data. A major factor in the success or failure of your analytics strategy is integrating the right data analysis software.

Robust analytics software allows business users to draw relevant data from selected sources to calculate dynamic KPIs which then offer you actionable insights. They also present the information in a visual, intuitive, interactive format in a single executive dashboard..This is a data analytics methodology anyone can use.


Choosing the right technology for data analytics and reporting helps avoid fragmenting insights, saves time and effort, and allows business users to extract the maximum value from their organizations data.

Within the data analytics and BI industry, a small number of vendors, including InetSoft, have been creating applications that allow the combination or mashup of disparate data sources to be improvised without necessarily relying on the IT heavy step of ETL and data warehousing. This is now being referred to as data mashup. While combining disparate data sources is a common application for a data mashup, even in a single data source environment a mashup can be made by combining data from different tables in a way that had not been previously anticipated.

Data mashup allows users to go far beyond the limitations of IT created obstacles, such as waiting on unnecessary change requests, work backlogs, and administrative overhead. InetSoft's BI platform for data mashup uniquely takes this data agility concept to the ultimate level by fusing data mashup with business analytics in one web app, allowing end-users to iteratively create and define data mashups on their own and immediately visualize and analyze the resulting data blocks. Data mashup flexibility applies to two common use cases. First, users can combine data fields from data sources that have been intentionally exposed to the BI platform but not yet mapped together in a data schema. Second, the end-user can bring in his or her own data and combine it with those made available in the platform.

What makes InetSoft data mashup so valuable to businesses is that the queries that are needed to combine data are generated behind the scenes of a user friendly drag and drop interface. You simply enjoy the benefit of greater access to data, and greater flexibility in building interactive dashboards, compelling visuals, and intuitive reports.

Users of InetSoft data mashup can repurpose Lego like data blocks for unanticipated questions.. Data blocks' built-in visual transformation and data cleansing functions make data preparation effortless with minimal technical skills. BI professionals can not only easily mashup disparate data into analytic data blocks, but they can also enable controlled self-service data mashup for users via data models. Data models map prepared data to business terms and completely shield end users from underlying technical details. Models' built-in governance enforces data consistency and safeguards data processing engine integrity. As part of data governance, the data security model can secure data down to the cell level where users will only access their personalized data.

Click here to learn about some real world examples of data mashups.

top ranked BI
Read how InetSoft was rated as a top BI vendor in G2 Crowd's user survey-based index.

Answer Questions

If all of the above steps are followed, the right technology is used, and a culture of pervasive analytics is established where all different kinds of employees are empowered with the different ways to analyze data, the most crucial business questions will be answered.

Experience has shown that the best way to make data analysis accessible throughout an organization is by by providing employees with data visualization tools.


Visualize the Data

Data visualization, is the study of the visual presentation of information, such as complex numbers and statistics, in a clear and beautiful way through mediums such as bar and line graphs, or pie charts. A closely related term, Information visualization, is defined as: visualization is a process of transforming information into a visual form, enabling the viewer to observe, browse, make sense, and understand the information.

Data visualization software provides features to easily create visualizations that effectively communicate information. By enabling users to interact with data, the software opens tremendous opportunities to view data in many different angles. It transforms the data visualization from a presentation technology to an analysis process.

Data visualization is the means by which more and more organizations are answering key questions about their businesses. Visualizations have advanced in the post-digital age to become much more dynamic, interactive, and present even more crucial information. Visualizations deliver important stories and messages about one's business operations, trends, performance, and more, in novel ways.

Data visualization enables decision makers and end users alike to sift through important information and numbers quickly, and at that, with much more ease than before when people had to read long spreadsheets and try to understand lots of complex data.

With a visual display of all that complex data, users are empowered with a better understanding of the information. Numbers may look different when taken from a spreadsheet and plugged into an attractive and dynamic chart. This shift in perception allows people to perhaps see things they did not previously and therefore become more informed, spot trends, monitor key metrics more closely, and essentially become more efficient decision makers for their business.

Vital business numbers and information coupled with attractiveness and interactivity suddenly bring a simple display of information to an accessible and visible way to become more successful as an enterprise.

Visuals provide deeper insights into key metrics, which in turn allow a business to solve their problems more efficiently and quicker - perhaps a moving gradient on a chart allows a CEO to spot a declining trend that he or she would have otherwise not noticed on a static spreadsheet. Now, management is making better plans for the organization's future. Plus, it did not take hours of sifting through complicated data.

Visuals are fast becoming a highly valued tool for gaining a a true sense of business performance. Previously, a manager might have been able to see how each of his sales people were doing in a quarter. With the power of visuals, that same manager may compare each quarter, each sales person, and further, find the answers to exploratory questions such as "What are the characteristics and trends among our highest paying customers?"

Further, a manager may not remember exactly how much revenue each department made in a quarter, but he or she may very well remember how big or small a visual bubble representing each department was. Visuals lead to improved management. Data visualization tools can also reveal important patterns, help expose a weakness or issue in your business, present and compare large amounts of information at once, and allow organizations to dig deeper in a "slice and dice" manner into crucial data.

dashboard demo
View a 2-minute demonstration of InetSoft's easy, agile, and robust BI software.

The purpose of data analysis should be making everyone in the entire organization more aware of what's going on. With the right data analytics platform this is easier than you think, as demonstrated by this InetSoft marketing dashboard.


marketing lead trends dashboard

Primary KPIs


This visual, interactive intuitive cloud based marketing dashboard is designed to give Chief Marketing Officers (CMO) an overview of lead acquisition efforts, with several key lead metrics to help them understand if they are acheiving their monthly goals

In detail, this dashboard displays interactive charts for lead flow, leads by source over time, leads by state, and also lead conversion rates so that the CMO can understand whether the leads coming in are qualified or not. In addition, it features an option to adjust the highlight by change rate on conversion rate, to give an overall picture of lead and conversion progress and extract relevant insights or trends for marketing reports.

This lead source dashboard is perfect for c-level management since it aids in monitoring the strategic outcomes of lead acquisition and conversion efforts, encouraging data driven decision making that can benefit the marketing department and the overall business.

Interpret the Data

Data interpretation is a fundamental aspect of the data analysis process. Interpreting data gives meaning to the analytical information and aims to derive concise conclusions from analysis results. As data often comes from a variety of different sources, data interpretation must be done carefully and with precision in order to avoid misinterpretation and incorrect conclusions.

While going through the process of data interpretation, there are three common pitfalls to avoid.


Confusing correlation for causation

Our minds are designed to notice patterns. While this trait has been essential for our survival, it can sometimes lead to a common mistake when interpreting data: confusing correlation with causation. Although all attributions of causation begin with observing correlations, it is not correct to assume that because two events happened together, one caused the other. This is why it is important to never simply trust ones intuition when interpreting data. Without objective evidence of causation, one merely has a correlation.

Confirmation bias

This bias is the tendency to select and interpret only the data that supports one particular hypothesis, while ignoring the data that would disprove it. Even when unintentional, confirmation bias is a real problem for a business analysts, since excluding relevant information creates false conclusions and bad managerial decisions. To avoid confirmation bias, it's recommended to try and disprove one's own hypothesis instead of proving it. Sharing the analysis with other team members and asking for feedback can also help guard against bias. As a general rule, do not draw conclusions until the entire data analysis process is finished

Insufficient statistical significance

The amount of statistical significance will indicate to an analyst whether or not a result is actually accurate or if it could have happened due to chance or sampling error.

What level of statistical significance is needed will depend on the sample size and also the industry or department being analyzed. Regardless, ignoring the statistical significance of a result can lead to serious mistakes in organizational decision making.

dashboard demo
View a 2-minute demonstration of InetSoft's easy, agile, and robust BI software.

Building a Narrative


Now that all the technical applications of data-driven analysis have been explored, the next step is to bring all of these elements together in a way that will benefit the organization, - beginning with data storytelling.

The human mind is extremely narrative driven. Once the most valuable data has been cleansed, shaped, and using state of the art BI dashboard tools, one should strive to use that data to tell a story, a story with a beginning, middle, and an end.

This will make analytical efforts more accessible, intuitive, and digestible, which empowers more people throughout the business to use data discoveries to improve their decision making.

Considering Autonomous Technology

Autonomous technologies, such as machine learning (ML), and artificial intelligence (AI) are playing an increasingly significant role in helping business owners glean fresh insights The analyst firm Gartner has predicted that by the end of the year, 80% new technologies will feature AI in some aspect. This underscores to the expanding power of these autonomous technologies.

These new technologies are turning the data analysis industry upside down. They include the previously mentioned technologies neural networks, intelligent alerts, and text analysis.

Machine learning extracts information from data that is not apparent to even experienced business users. Data scientists normally spearhead this process using specialized data science tools such as Python and R, but business users are often limited to static ML output and reports.

The reason machine learning is needed is that there are some problems for which it is very difficult to write software program to solve, such as recognizing a three-dimensional object from a novel viewpoint in new lighting conditions in a cluttered scene. This kind of function has traditionally been very difficult for a non human system to perform. Without understanding how are brains process this, it was hard to know what program to write, and attempts at doing so were horrendously complicate.

Another example is using software to detecting a fraudulent credit card transaction, since there may not be any nice simple rules that will indicate the transaction is fraudulent. This requires the combination of a very large number of not very reliable rules, and those rules change must over time as people change the tricks they use for fraud.

With the machine learning approach, instead of writing a program by hand for each specific task, for a particular task many examples are collected that specify the correct output for giving an input. The machine learning algorithm will then takes these examples and produces a program that does the job. The program produced by the learning algorithm may look very different from a typical handwritten program.

Read why choosing InetSoft's cloud-flexible BI provides advantages over other BI options.

The program might contain millions of numbers concerning how different kinds of evidence are weighed. If done correctly, the program should work for new cases as well as the ones it is trained on. And if the data changes the program can be changed relatively easily by retraining it on the new data.

The beauty of this approach is that masterminds of computation are cheaper than paying someone to write a program for a specific task, so companies can afford big complicated machine learning programs to produce these task-specific systems.

Machine learning is also effective at recognizing anomalies. In the fraud detection example, an unusual sequence of credit card transactions would be an anomaly. Another example of an anomaly would be an unusual pattern of sensor readings in a nuclear power plant, for which anomaly detection analyses would be performed so the algorithms can learn to detect when the system is not behaving in its usual way.

Another application of machine learning applications is for predicting things like future stock prices or currency exchange rates. It could even be used to predict which movie a person will like from knowing which other movies they like and which movies a lot of other people liked. All of these are examples of how machine learning can be used to quickly spot anomalies, trends, or clusters

For more on machine learning, here is an article by InetSoft CTO Larry Liang.

Sharing the Load

When the right tools and dashboards are used, metrics can be presented in a digestible, insight driven format, encouraging everyone in the organization to analyze relevant data and use it to their advantage.

Modern interactive dashboards pull and combine data from a variety of sources, delivering actionable insights from one centralized source, no matter if you need to monitor HR metrics or create reports that are due across numerous departments. In addition, these state of the art tools offer dashboard access on a host of different devices, meaning that everyone within the organization can connect to data insights anywhere.


When everyone adopts a data analytics mindset, it can result in business growth that was previously thought to be impossible. When it comes to data analysis, it pays to take the collaborative approach. This approach leads to an organizational culture known as pervasive analytics, meaning that analytics are being used to make both big and small decisions.

Any decisions that contribute to the company's performance are made based on facts and insights from leveraging the data at hand, not just gut feel decision-making. Pervasive analytics help a company reach new heights, whether in terms of financial performance, best-in-class customer service, or having the best products on hand when customers need it.


The biggest indicator of a culture of pervasive analytics is that all workers, executives as well as frontline workers, recognize that analytics are mission critical. They couldn't do their jobs effectively without data analysis. Unfortunately this recognition is still quite low in most companies. Usually it's the knowledge workers or the "power users" who only consider business intelligence mission critical.

top ranked BI
Read how InetSoft was rated as a top BI vendor in G2 Crowd's user survey-based index.

Robust Analytics Tools

For the best-quality data analysis, it is essential to have the best quality software solutions that will ensure the best insights. As the analytics industry continues to expand, a greater variety of robust analytic tools become available. Here is a brief summary of types of data analysis tools for your business.

Business Intelligence

BI software gives its users the ability to process very large amounts of data from from a variety of sources in any format. With this technology, not only can data be e analyzed and monitored to extract actionable insights, it can also be converted into interactive reports and dashboards to visualize key metrics, using them to better manage an organization. InetSoft is an incredibly robust online BI software that can deliver powerful online analytics to both beginner and advanced users alike. InetSoft Style Intelligence a full-service business intelligence solution that includes state of the art data analysis, flexible KPI visualization, live interactive dashboards, and reporting, and machine learning algorithms to predict trends and minimize risk.


Statistical Analysis

These kinds tools aredesigned with data scientists, statisticians, market researchers, and mathematicians in mind, as they are used to execute complex statistical analyses such as regression analysis, predictive analysis, and statistical modeling. A popular tool to perform this type of analysis is R-Studio , known for its powerful data modeling and hypothesis testing feature that makes it suitable for both academic and general data analysis. This tool is an industry favorite since it is effective at data cleaning, data reduction, and advanced analysis through several statistical methods. Another popular tool to mention is SPSS from IBM. This tool offers advanced statistical analysis to both experienced and inexperienced users. With a vast array of machine learning algorithms, text mining, and a hypothesis testing approach, it helps companies find relevant to drive their decision making. SPSS also functions as a cloud service, so these analyses can be performed anywhere.

SQL Consoles

SQL, or Structured Query Language, is a programming language used to handle structured data in relational databases. SQL tools are popular among data scientists since they are useful for performing analytics on SQL databases. The most popular and established SQL tool is MySQL Workbench, which offers visual tools for data modeling and monitoring, SQL optimization, administrative tools, and visualization dashboards displaying key metrics.

Data Visualization

Data visualization software is used to represent data with charts, graphs, and maps, allowing non technical users to find patterns and trends in the data. InetSoft's BI solution includes a powerful data visualization tool that can benefit any business.


This robust visualization engine can be used to deliver compelling data-driven presentations to executives and shareholders, and empower users to see their data online with any device wherever they are, an interactive dashboard design feature that enables results to be showcased in an intuitive and interactive way, and to execute online reports that can be worked on simultaneously by several other people to enhance collaboration.

Click to read InetSoft's client reviews and comments to learn why they chose InetSoft.

The term big data refers to data sets that have grown to be so large that traditional tools are no longer usable. With the usage of big data sets across growing industries, it has been crucial to develop tools that can easily run queries and analyses on vast amounts of data, while presenting the information in a way that makes it easier to understand.

Big data is becoming an invaluable aspect of today's businesses. It pays to try new methods for data analysis, since they can help one see the data in a new way, yielding insights that inspire positive action.

To underscore the importance of big data, here are some facts about the recent growth of big data and the use of it in data analysis.

By the year 2023, the big data industry will be worth $77 billion dollars.

94% of enterprises say that data analysis is crucial for their business growth and digital transformation.

Companies that realize the full potential of their data increase operating margins by 60%.

Artificial intelligence, which has been described previously on this page, is expected to grow up to $40 billion by the year 2025.

There are many different concepts in data analysis, but experimenting with their implementation can help to grow any organization, while also increasing efficiency, improving brand, and bettering organizational culture.

InetSoft's data grid caching technology enables fast analysis on big data sources by using a state-of-the-art combination of in-memory database reporting and disk-based access, which means that users will never have to deal with unnecessary lag time.

The software's user friendly interface allows users to manipulate and explore their data without having to rely on IT. This self-service not only reduces the company's overall costs but also allows for more collaboration within the workplace on the data visualizations, as anyone with a basic understanding of excel can create and explore dashboards.

InetSoft's Style Intelligence can natively access big data stores such as Cassandra, Hbase, MongoDB. Since Style Intelligence's big data deployment is natively built upon Apache Spark/Hadoop., it can not only be dropped into an existing big data environment, but it can also be deployed with its self-managed environment.

Read how InetSoft was rated #1 for user adoption in G2 Crowd's user survey-based index.