Analytical Tools Examples
Is your company's data too big and complex to understand? InetSoft is your solution! With InetSoft's analytical tools, you can expect fresh new insights that will increase both the internal and external performance of your organization.
Data analysis is the process of evaluating data and drawing conclusions. When used properly it can help an organization discover things that they would not have otherwise known. Data analysis is implemented in many different fields, such as construction, healthcare, and education as well as many others.
For example, in the construction industry, modern construction projects involve various cost reports to make sure money and labor hours are all accounted for correctly. This is where InetSoft's data analyzing software comes in.

Using InetSoft's analytical tools takes data analysis to the next level, giving the user a visual representation of the data in charts, graphs, and other various special features that can help decipher certain patterns and trends from the data as a whole.
InetSoft's analytical tools is superior to any competitors due to its easy to use interface which allows any kind of user, whether beginner or expert to manipulate any kind of data. InetSoft's program requires very little training and meets most ad hoc reporting needs. Complicated data transformations and queries are also possible from an array of different data sources. Expensive BI experts or consultants are not needed, which eliminates additional costs.

Analytical Tools with Ad Hoc Editing
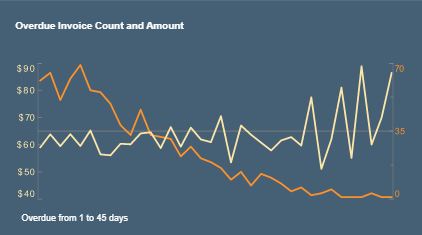
InetSoft's interactive dashboards provide the user with a visual representation of analysis. By visually interpreting the data the user can then see possibilities they couldn't before. The dashboard can be manipulated to show only certain data points, isolating one single variable and seeing how it affects the group as a whole.
For instance, the pencil tool can be used to change the dimensions and measurements of the chart as well as what data is actually being shown and how that data is shown visually. The user also has the option of changing the shape, size, color, and text to their own specifications.
The individual charts can also be increased in size from the dashboard itself to isolate the chart from the dashboard, making the chart clearer to the user. Lastly, the actual data from an individual chart can also be shown, allowing the user to take a closer look at segments of the data that show interesting results.
Another useful feature is the brush tool. This enables the user to highlight data in more than one dashboard chart. Highlighting the same pieces of data on different charts enables the user to see trends they could have never seen before. It lets the user see the data in various formats, making it clearer to the user how that data affects the overall data set.
Data can also be restricted by filters. Specific variables can be incorporated into charts using the pencil too. Data is separated into dimensions and measurements which can be plotted on either the X or Y axis. Multiple sets of data can be plotted on either axis, creating multiple stacked charts depending on the amount of sets selected. Various charts are available to choose from, all of them can be changed depending on color, size, shape, and text.
How the chart or graph is displayed visually can make it easier for the user to understand how a certain data point can affect the data group as a whole. For instance, in the construction industry a bar graph could be used to compare employee’s salaries to the actual revenue each type of employee brings in. So the two different data sets would be represented by different colors making it clearer to the user the differences between the two variables.
Interactive Real Time Visual Analytical Tools
The flexibility of the InetSoft's analytical tool extends to the production of visually compelling dashboards that enable analysts to interact with data in real time. Rather than having to rely entirely on pre-built database queries, InetSoft's Data Block technology allows for a user-friendly data mashup in a Lego-like block fashion, visually representing data in a way that is understandable to business users.
From there, the mashed up Data Blocks can be transformed and assembled into personalizable, interactive dashboards, complete with capability for drilldown, brushing, and other features for robust data exploration.
With InetSoft's award-winning real time dashboard software, business users can get the up to date insights without having to rely on IT help.

About InetSoft
Since 1996 InetSoft has been delivering easy, agile, and robust business intelligence software that makes it possible for organizations and solution providers of all sizes to deploy or embed full-featured business intelligence solutions. Application highlights include visually-compelling and interactive dashboards that ensure greater end-user adoption plus pixel-perfect report generation, scheduling, and bursting. InetSoft's patent pending Data Block™ technology enables productive reuse of queries and a unique capability for end-user defined data mashup.
This capability combined with efficient information access enabled by InetSoft's visual analysis technologies allows maximum self-service that benefits the average business user, the IT administrator, and the developer. InetSoft was rated #1 in Butler Analytics Business Analytics Yearbook, and InetSoft's BI solutions have been deployed at over 3,000 organizations worldwide, including 25% of Fortune 500 companies, spanning all types of industries.
