Free Visualization and Charting
If you're looking for Style Chart, InetSoft's free embeddable charting service, we've replaced it with Visualize Free, an easy-to-use, no software download Web-based charting and visualization application.
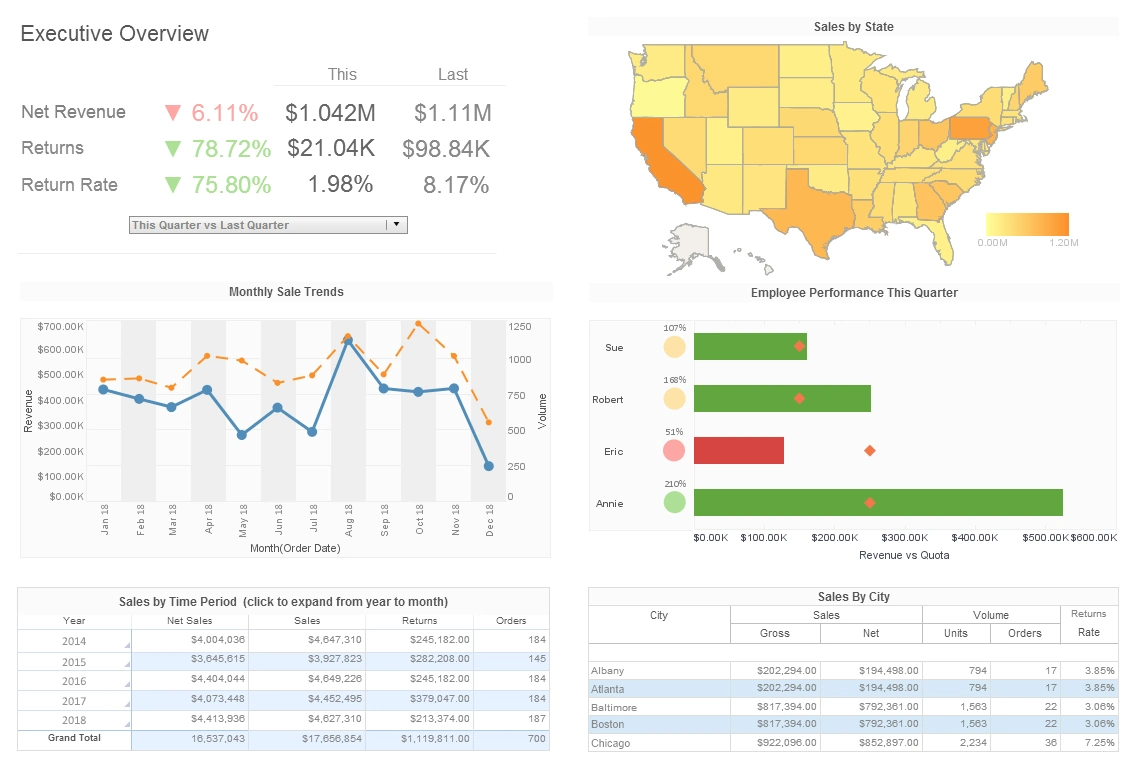
Derived from our commercial business intelligence software, this free charting tool is designed to be very intuitive and interactive.
Visualize Free is a Web-based charting service. Create an account, upload your spreadsheet or .csv file, and use the drag and drop chart designer to create anything from simple graphs to interactive visual analyses. Keep them private or share them with others.
As a no-software-download charting solution, all you need is a browser. You can create charts using any Windows, Unix, or Mac desktop or laptop, and consume them on the same, as well as mobile devices including iPads, Android-based tablets plus iPhones and other smart phones.
Features
- Multi-dimensional charting such as bubble charts, and trellis or multi-charts
- Brushing for data exploration (highlighting related data across multiple charts)
- Advanced geographic mapping
- Dual purpose input/output selection elements
- Calendars, range sliders, gauges, crosstabs
- What-if analysis, experimenting with scenarios by combining user input with dynamic data
- Export charts with high fidelity to Excel, PowerPoint, and PDF
Use Visualize Free to Evaluate InetSoft's Commercial Dashboard Software
Visualize Free provides an easy way to evaluate some of the capabilities of InetSoft's commercial visualization product, which is available as a standalone visual analysis and interactive dashboard application in Style Scope, and as part of a complete business intelligence software application in StyleBI.
Note that as a free visualization tool, Visualize Free naturally has limitations:
- The software is not to be used for commercial purposes.
- Data models, data mashup, simultaneous access to multiple data sources, and access to additional types of data, such as relational databases, XML, SOAP Web services, Java beans, and OLAP cubes are available in InetSoft's commercial BI applications.
What Is the Difference Between InetSoft's Visualize Free and InetSoft's StyleBI?
InetSoft offers two distinct products: Visualize Free and StyleBI. Here are the key differences between InetSoft's Visualize Free and StyleBI:
- Visualize Free: A free, entry-level data visualization tool for individuals and small teams.
- StyleBI: A comprehensive enterprise-grade BI platform with broad data connectivity and advanced analytics.
- Capabilities: Visualize Free provides basic visualization and limited features; StyleBI supports data mashup, transformation, and enterprise integrations.
- Scalability & Deployment: Visualize Free is suited for small-scale tasks; StyleBI supports on-premises and cloud deployments for enterprise needs.
- Support: Visualize Free has limited/community support while StyleBI offers professional services and training.

How a Student Used Visualize Free for a School Project
Meet Emily, a high school student passionate about environmental science. For her final project, she wanted to analyze and present data on local air quality trends over the past five years. Emily’s teacher encouraged her to go beyond static charts and explore interactive data visualization tools. That’s when Emily discovered Visualize Free, InetSoft’s no-cost, web-based charting service.
Emily began by collecting air quality data from her city’s open data portal. The dataset included daily measurements of pollutants such as PM2.5, ozone, and nitrogen dioxide. She saved the data as a CSV file, which she could easily upload to Visualize Free. The platform’s intuitive drag-and-drop interface allowed her to quickly import her spreadsheet and start exploring the data without any software installation or coding knowledge.
Using Visualize Free, Emily experimented with different chart types to find the best way to communicate her findings. She created line charts to show trends in pollutant levels over time, bar charts to compare average values across different neighborhoods, and bubble charts to highlight days with unusually high pollution. The multi-dimensional charting capabilities helped her uncover patterns she hadn’t noticed before, such as spikes in ozone levels during summer months and correlations between traffic density and air quality.
One of Emily’s favorite features was the ability to interact with her charts. She used brushing to highlight related data points across multiple charts, making it easier to spot relationships between variables. The platform’s mapping tools allowed her to visualize air quality readings geographically, providing a clear picture of which areas were most affected by pollution. Emily also appreciated the range sliders and filters, which let her and her classmates focus on specific time periods or pollutants during her presentation.
When it came time to share her results, Emily used Visualize Free’s export options to generate high-quality images for her report and slides. She also created a public link to her interactive dashboard, allowing her teacher and classmates to explore the data themselves. This interactive approach impressed her audience and sparked a lively discussion about environmental issues in their community.
Throughout the project, Emily found Visualize Free to be accessible and reliable. She worked on her charts from both her home laptop and the school’s computer lab, thanks to the platform’s browser-based design. There was no need to install any software, and her work was always saved securely online. The community support resources helped her troubleshoot questions and learn new visualization techniques.
Emily’s experience with Visualize Free not only helped her achieve a top grade on her project but also gave her valuable skills in data analysis and visualization. She learned how to transform raw data into compelling visual stories, a skill that will benefit her in future academic and professional endeavors. Emily’s teacher now recommends Visualize Free to other students looking for a powerful yet easy-to-use tool for data-driven projects.
For students like Emily, Visualize Free offers an ideal introduction to the world of data visualization. Its combination of intuitive design, interactive features, and flexible sharing options makes it a valuable resource for school projects across subjects—from science and math to social studies and economics. By empowering students to explore and present data visually, Visualize Free helps foster critical thinking and digital literacy in the classroom.

More Resources for Visualization Charting Newbies
Automated Reporting for HR Dashboards - Perhaps one of the most prominent benefits of HR executive dashboards is the ability to get automated reporting. This allows you to get all the necessary data at your fingertips just in time without having to perform any additional processes.
Evaluate InetSoft's Business Intelligence Application Development Tools - Are you looking for good business intelligence application development tools? InetSoft is a pioneer in providing powerful and flexible software for creating customized dashboard and reporting applications. View a demo and try interactive examples...
Introductory BI Articles - Looking for an introduction to business intelligence? InetSoft is a BI software provider, and here you can view demos, see customer examples, and read articles explaining the basics of BI and best practices for implementing successful business intelligence...
Kickstarter Analytics Dashboard Example - From art to technology, crowdfunding projects are making a lasting impact on society, culture, and the economy. Kickstarter, the largest crowdfunding platform in the United States, has helped fund 221k creative projects successfully, generated $13.5 billion in economic impact, boosting overall employment...