Corporate Performance Management Solution Comparison
This table compares key Corporate Performance Management (CPM) capabilities across InetSoft, Cube, SAP Analytics Cloud, Board, and Prophix.
Each solution has distinct strengths: InetSoft excels in semantic modeling and data virtualization, while Cube and Prophix offer cost-effective alternatives for simpler use cases, and SAP Analytics Cloud and Board provide deeper integration for enterprises already invested in their ecosystems.

Related Resources
How Loan Originators Use Data Analytics - Fintech companies and NBFCs are leveraging cutting-edge predictive data science to revolutionize the lending process. With automated risk analysis and lightning-fast loan disbursements, these innovative organizations can now make informed decisions in record time, resulting in reduced risks for all involved. With modern lending software and apps, borrowers can quickly apply for loans from anywhere. All it takes is a few taps on their phone. The algorithm powering this service uses predictive data analytics to determine if applicants qualify according to pre-set criteria. Once approved, funds are credited almost instantly, so you'll never miss out when times call for swift access to cash. Let's take a look at how predictive analytics is assisting loan firms in making better decisions...
How Machine Learning Is Changing Business Analytics - Thank you all for joining us today for a discussion about how machine learning is changing business analytics. We have four major points that we want to discuss today. The first one being the importance of data science and data scientist and bringing machine learning into organizations. The second one being we've all heard of the V's of big data. and we know that one is velocity, and we know that there's a lot of streaming data out there now. This is going to be a big part of organizational strategies moving forward. Point three, how an organization can keep creativity with machine learning. We have all of these different tools to choose from today, all of this different data, but we deal with regulation, we deal with documentation, we deal with productionizing code. How do we keep infusing creativity into the machine learning workflow within an organization? Then, we've also heard a lot about the citizen data scientist recently and just in general more and more people in organizations wanting to get involved with analytics and machine learning, so that's point four. Okay, so we're going to start our discussion here. Is any of this really new? Is machine learning new? Is data science new? To me this is resounding no. In fact, machine learning has been studied at least since the 1950s, maybe before. Data science you could say goes back to John Tukey's 1962 Future of Data Analysis Paper. There's a great recent paper by David Donoho out of Stanford that talks about 50 years of history of data science, and I urge you to read that. We have a link to that at the end. We're seeing machine learning in organizations now. This isn't coming out of the blue. This has a long history, and so we wanted to spend a little bit of time here. One good thing to do at first is of course to define machine learning, and that's really tricky. I think for better or for worse, in a certain sense machine learning has taken on sort of a pop culture, meaning it's just the rebranding of analytics or data mining...
How Marketers Measure Content Effectiveness - It is accepted that the effectiveness of content cannot be calculated in a moment - content works gradually and has a cumulative effect. The material in the media will be indexed in a search for several years, and a mailing list can fuel an audience for several months before purchase. The effectiveness of content is also difficult to monitor for the reason that, as a rule, a company uses several channels of communication. But not all of them have end-to-end analytics implemented. For a business that doesn't have a large marketing department, it's difficult to create dozens or hundreds of segments, evaluate every touch with the audience, and test hypotheses. It is difficult to convert content into money, but it is possible. The main thing is to figure out what to count...
How A Modern Data Pipeline Helps Reporting - A modern data pipeline is a set of processes and tools that work together to extract, transform, load, and analyze data from various sources. The primary goal of a modern data pipeline is to create an efficient and reliable method for moving and processing data, enabling organizations to make data-driven decisions. Reporting is a critical function in any organization. It involves analyzing data and presenting it in a way that is meaningful and actionable. Reports can be used to monitor performance, identify trends, and make informed decisions. However, traditional reporting methods often involve manual data processing, which is time-consuming and prone to errors. A modern data pipeline can help reporting by automating many of these processes. The first step in any data pipeline is data ingestion. This involves collecting data from various sources, such as databases, APIs, and data lakes. A modern data pipeline can automate this process by using tools such as data connectors and APIs. These tools allow data to be collected from various sources, processed, and stored in a centralized location, such as a data warehouse or data lake. By automating the data ingestion process, organizations can save time and ensure that the data is accurate and up-to-date...
How Much Data To Start Predictive Analytics - Yes. The next question I have, and this is an old chestnut that we're constantly asked when talking to organizations throughout all industries. When do you know you have enough data to start your predictive analytics and what type of data should you be looking at? Again, Natalie, would you like to comment on that? Natalie: Yes, so I think it's difficult to answer that in terms of when do you know you have enough data. There's never a time when you should limit the analysis that you do because of data. You can always do something with whatever data you have. There's always a starting point, and there's always something that you can do. I think that like for me personally data is obviously what drives us here and the use of it, and one of the first things I would always do with organizations is assess their level of data. What do you have? What could we do? How could we align with your strategic goals. Yeah, so there's no point with which you should limit yourself. In fact we always start with them with small amounts of data. Jessica: Tony any comments there...

How Performance Management Consultants Work - Today’s session is about how performance management consultants work. I am going to talk about some really commonsense things today. There is nothing that is rocket science. It's really an integrated framework in how I approach working with organizations when it comes to trying to improve their performance, trying to improve their processes, whatever it may be where they feel their pain. When we look into organizations, what really are organizations? Well you have people. You have a plan that may be a strategic plan, a business plan. You have got policies. You have got processes. You have got procedures, and why are you doing all that? Well, to achieve a certain performance to meet the vision of the organization. So, if you read the fine print, it's really people that use a plan, use policies, processes and procedures to achieve the desired performance. Why is strategy important, and what’s the linkage between strategy and execution? I am going to be focusing on a lot, on execution, not so much on strategy. Well, if you are looking into the business world, you are going to know that most organizations have a very sound strategy, have worked diligently on defining a strategy. But in the majority of cases when they fail, it's not because a strategy was faulty, it's because they didn’t execute against that strategy...

How to Add Annotations to Key Performance Indicators - You can add annotations to a Dashboard, to an individual Dashboard component, and even to an individual data point. The following sections explain how to do this. NOTE: This feature is available both to designers and end-users. To add annotations to the body of the Dashboard, follow the steps below: 1. Select the bookmark in which you want to save the annotation. (See Bookmark a Dashboard for information on selecting a bookmark.) 2. Right-click in an empty region of the Dashboard, and select 'Add Annotation' from the context menu. This opens the annotation in the Annotation Editor...
How to Pick the Right Key Performance Indicators - We can pick many key indicators, but the ones that are really the most critical ones and the ones that really matter are the key performance indicators you personally actually target. So you want to target specific people, and you want to do that by interviewing people, and you want it not by trying to wear the hat of a consultant or an IT guy or an MBA. Maybe you just want to pretend you are kind of investigative journalist. It's very easy in this project to get lost in technology and requirements documents, and often even having done charts, being people, we forget that intelligence, business intelligence is not achieved when data is collected and stored and/or thrown up on a dashboard, but when the data is understood by humans. Now, the next point is that you want to make sure that the dashboard is more relevant by giving people choice, and how do you do that? When we created our BI visualization application, we really emphasized the importance of letting people choose what they see on their home screen or even on their specific dashboard, so in InetSoft's application, some of our clients have 100s of dashboards and metrics. We only decided to summarize all those dashboards in tiles and allow our users to build their own custom home screen that contains different tiles...
How to Sort Data in Charts and Tables - Sorting data with a click of the mouse is one of the easiest ways to explore data. The following sections explain how to sort data in a table and a chart. NOTE: This feature is available both to designers and end-users. To sort a table column or crosstab column, hover the mouse over the right side of header or data cell and press the 'Sort' button. Press the button once to sort in ascending (alphabetical) order. Press the button a second time to sort in descending (reverse-alphabetical) order. Press the button a third time to restore the original order. For a crosstab, hover the mouse over a cell to display the current sort order for the field. An up-arrow means "ascending". A down-arrow means "descending". An up-arrow or down-arrow accompanied by a sigma indicates that the field is sorted by aggregate value. For example, if you sort an aggregated field in ascending order, the sort indicator for the dimension shows that it is sorted in ascending order by the aggregate value. (See Add a Table or Crosstab for more information about setting sorting in a crosstab.) To sort chart groups based on a measure, hover the mouse over the desired measure axis. This displays the 'Sort' button next to the axis. Press the button once to sort the groups in ascending order by measure value, press a second time to sort in descending order by measure value, and press a third time to restore the original order...

How to Track Password and Permission Changes at the Enterprise Level - Despite being able to sway policymakers and command vast physical resources, data remains an enterprise's most valuable commodity. After all, any enterprise that doesn't understand its customer base and make data-driven decisions can't compete on the world stage. Safeguarding data is, therefore, a top priority. It's also a challenging task since cybersecurity threats keep multiplying and evolving year after year. Unauthorized passwords and permission changes are common means of pursuing access. What steps should enterprises take to track them? Keep reading to get a complete picture. Enterprise operations generate and rely on vast quantities of data. Much of that data is sensitive, and unauthorized access could have dire consequences. For example, client databases can contain identifiable information such as names, (email) addresses, and banking info for thousands or even millions of people. With so much on the line, data breach costs can soar...
How To Track the Performance of Lead Distribution and Routing - Managing prospective customers, a.k.a. leads, is a fundamental pillar of a successful business operation in today's fiercely competitive digital marketplace. This process is divided into two crucial components - lead distribution and lead routing. Both aspects play a significant role in enhancing sales success and require systematic performance tracking. Advanced software technologies have revolutionized this process, making it an accessible and efficient tool for businesses. Let's explore these interesting paradigms and their vital role in modern business practices. Lead distribution implies the assignment of potential customers or leads to the various members of a sales team. The proficiency of this distribution can greatly impact a business's financial performance, emphasizing the importance of robust lead distribution software. Llead distribution software transcends the purpose of a digital registry. It is a powerful tool, ingeniously designed to assign leads based on a set of predefined criteria. This ensures a balanced distribution across your sales force...
How to Use AI Machine Learning Software in Your Business - To many people, AI and Machine Learning are only concepts, things of the distant future, something that we have to wait years for. However, the truth is that we're already on the verge of AI revolution, and the increase in the ease of use of machine learning software has been rapidly increasing its impact in a number of industries. From simple AI-powered chatbots using natural language processing technology to complex autonomous driving systems and warehouse management systems able to deliver a huge increase in efficiency and effectiveness, the world has been using AI-powered tools for quite a while now. For businesses, AI and machine learning software represents a great opportunity to gain competitive advantage, increase sales, and remain relevant for years to come. Many well-known companies are already using machine learning to achieve their goals; for example, DHL deploys it to increase effectiveness and efficiency of their logistics chains and warehouse management, UPS uses machine learning to determine the fastest routes for drivers, and Tesla has AI-powered platforms for self-driving cars. In other words, the future is much closer than you think. "Adopting AI to improve operations is something that you have to do as soon as possible to become an early adopter and outperform your competition," recommends Allison Borders, a digital business advisor at Collegepaper. Here are some potential uses of machine learning software to advance your business and meet the challenges of the future...

How to Use Artificial Intelligence for Customer Support - It's common knowledge that customer support is currently among the top priorities for most companies today. Thus, they are constantly looking for new ways to level up customer support and improve customer experience. It's no secret that customer services often have to deal with tons of inquiries a day, making a job of a customer support representative one of the most stressful. However, with the introduction of artificial intelligence (AI), we received features like machine learning and automation that fundamentally change the way how customer support works. Implementing AI in customer support is not money spent in vain. Evidently, more and more companies are ready to invest in AI-powered customer services. It is expected that investments in AI will increase by more than 300% during this year and eight out of ten businesses have already adopted AI-powered customer services or are planning to do so. Apparently, AI in customer support is an investment worth its money, bringing tons of benefits to both businesses and their customers, including: Reduced waiting time. What customers hate the most is waiting too long to receive a solution for their problem, especially if the issue isn't complicated. Introduced by AI, machine learning helps track similar issues, categorize them and search for solutions faster, reducing the time for resolving a ticket. Automated search. With the help of machine learning, customer service can create guides for their clients faster, referencing similar cases and offering quick solutions. Improved predictability. AI-powered features automate customer support to the point that a customer support representative can predict what the issue is from the very first clues, helping find a solution faster...
How We Can Get Started Implementing A Machine Learning Solution - This brings us to the next point about how we can get started implementing machine learning solutions. First I think we've seen increasing machine learning processing power that's really required, and it enables you to increase your computing power. Additionally enterprises can implement machine learning when they're dealing with very specific scenarios and very specific conditions. We were discussing already a ton of examples for this. Machine learning is able to make predictions on new data and automate repetitive tasks like the support ticket classification I mentioned earlier, which is a good way to start. We see also enterprises need to properly prepare the data by minimizing their information silos and developing a real time modern data analytics infrastructure. Now we see many organizations are organized by department and have data silos. They need to integrate the data from all the different sources, such as customers and their supplier sources because otherwise you cannot fully use the algorithms if you don't have the relevant data and if you don't have the right quality of data. I think what we see as well is a movement towards the cloud for data storage. To have your data all in the cloud in order to process these high volumes of data that are integrated from all various sources. Moreover, enterprises need to align, and this I think is very important because it's not only technology. They need to align their people, the processes and the technology to create a different and a better organizational foundation that supports this digital core and data driven thinking...
HR Operations Analyst KPIs - Human resources (HR) operations analysts constantly try to improve efficiency, productivity and morale. They accomplish this by using key performance indicators (KPIs) and statistics to objectively measure certain workplace characteristics, turning soft data into measurable metrics. What do they usually look for? Absence Rate and Cost How often do employees call in sick or skip work altogether? Analysts find this figure by dividing the number of absences by an employee's total number of days at work. They can use the data to create an HR report. They also look at the impact of absenteeism on the company, specifically, how much money it costs. HR analysts factor in salaries, the amount of lost work and the cost of filling in for the employee in their absence. It can be a crucial metric in workplaces with strong labor unions and employee rights...
HUD Performance Management Example - The Department of Housing and Urban Development (HUD) is responsible for monitoring and managing the availability of shelter, and includes a research branch called the Office of Policy Development and Research (PD&R). According to its mission statement, "PD&R is responsible for maintaining current information on housing needs, market conditions, and existing programs, as well as conducting research on priority housing and community development issues. The Office provides reliable and objective data and analysis to help inform policy decisions." To be able to do this, the Office must able to marshal large data sets and present them in a simplified manner using Business Intelligence tools. An example of this can be seen in the housing market reports the Office produces on a regular basis (https://www.huduser.gov/portal/ushmc/hmi-update.html)...
Improving Business Agility Using Performance Management Software - Welcome to our Webinar on “Improving Business Agility Using Performance Management Software.” I will be your moderator for this Webinar. But before we get to the topic, let’s get some simple housekeeping items out of the way. First, this event is completely interactive, and we do mean that. It incorporates many social networking tools that enable you to tweet or directly post information to your Facebook and/or LinkedIn page right from the console. You don’t have to change consoles to do that or go to the Internet. You can do it straight from the console. Just scroll along the bottom of the screen and click on the social networking widget of your choice and have fun with it. We encourage you to do so. Also if you have a question, please don’t be shy. Hit the ‘Ask a Question’ button located on your console and we will get to your question during the event or during the live Q&A at the end of the event depending on how much time we have. We will answer as many questions as possible so please we invite you ask away and ask often. Also you can download a copy of today’s presentation to your desktop so you can go ahead and do that as well...
Improving Corporate Performance Management - Welcome everyone. We are so pleased to have you here today to hear about the latest techniques to improve corporate performance management, what we are calling an intelligent pursuit, a business intelligence. As you all know, the CFO is the steward of his or her company’s financial data, is likely closer to it, and understands it better than anyone else. Now more than ever, the pressure is on to make sense of this data, to derive insight from it and define meaning in the numbers that help drive profitable business growth and avoid risky blunders. To do that well, to have the time to do it effectively, to find the answers that will help move the business forward, the Finance Department needs to be a well-oiled machine with a thoughtful leader. And this leader, of course, is the CFO. He or she is entrusted with the duty to ensure the extensive collection, dissemination, and analysis of enterprise data for decision making purposes. This ability to provide such business intelligence quickly and accurately is a competitive advantage for the companies that efficiently attend to the task, improving overall corporate performance and shareholder & owner value...

Increasing Call Center Performance - So the one tip is to rethink benchmarking, and the next tip is to spend right. In other words, let’s not overspend in some areas. A third would be summarized by this phrase "too simple to be accurate." What we are talking about here is the common perception that any increase in performance in something like a phone system or a call center or any other output which would be represented on that horizontal axis on the bottom of the chart is good. Any increase in service level will lead to an increase in outcomes. If we answer the phone more quickly, people will be happier. If we respond by mail in nine days instead of 10 days, that’s better. You know what? That’s not necessarily true. This very straight diagonal relationship we estimate on this chart is simply inaccurate. Let me show you what’s the real connection between driver change and expected change in outcomes...
Ineffective Customer Satisfaction Measuring Methods - Traditional practices in customer measurements include using surveys but have very little significance in improving customer satisfaction and business.Number seven, I am still seeing a lot of ridiculously ineffective customer measures. You look at the whole customer section and most scorecards and how do you think most organizations measure customer satisfaction surveys? What’s wrong with the survey? It’s old. What else do you have besides the customers you already have? Do most of you fill out all the surveys you get? I don’t, and I get surveyed to death. I get surveyed by my dentist, by the guy who fixes my car, my gardener, and sometimes I get a dollar in the mail. Have you ever received a dollar in the mail with the survey trying to make you feel guilty? I keep the dollar and feel guilty for about five seconds and throw the survey in the trash. I find that two types of people fill out surveys: mad ones who hate you and bored ones, who don’t have enough work to do. I kill an hour filling out these surveys. So I am not a big fan of customer surveys. The latest and real dangerous trend, I think, is not to ask 10 questions or 15 questions but to ask just one question on willingness to recommend on a 1 to 10 scale. Did you guys hear about the big cover story in Business Week about some guy from GE saying this is going to be bigger in six sigma? Do you think a one question survey would differ if the check engine light on your car came on this week three times versus you getting the survey last week and the check engine light never came up? It would make a big difference wouldn’t it? Do you think you could have a vendor you’ve been doing business with that you give a 10 on willingness to recommend and then they screwed up something really bad this week and all of a sudden, they are out the door? It could happen...
InetSoft Data Intelligence - The Importance of Modeling Plus Viewing for Delivering Efficient Business Intelligence A data driven business needs to empower everybody, from C-level executives to frontline workers, with intelligence from data to make smart business decisions. Recent advances in business intelligence (BI), particularly the wide adoption of visualization technology, have greatly expanded and simplified accessibility of data. However, visual dashboards are still just one step forward in the pursuit of self-service BI because it is limited to pre-designed interactivity for end users. The new frontier of data science (DS) is opening a new world of intelligence. The ability to process a great amount of data of ever expanding variety is within reach for many, thanks to low cost cloud computing and open source technology. Machines with advanced learning algorithms are extracting intelligence autonomously. But the insight rewards of data science are hard to access for non-technical users...
InetSoft StyleBI vs InsightSquared - With so many BI solution providers out there it is difficult to know which product is the right fit. G2 Crowd is a peer-to-peer Chicago based company that provides reviews of other companies' software products. It has strong protection protocols to ensure that there is no bias, including algorithms to detect fraudulent reviews, verification processes, and community voting procedures. Data from all reviews are aggregated and broken up into various categories based on the visual, analytical, procedural and advanced capabilities of the software...
InetSoft StyleBI vs Plecto - InetSoft is one of the best Business Intelligence vendors on the market, an all around BI platform that offers actionable insights for business users at thousands of organizations worldwide. InetSoft StyleBI's customer ratings recorded by analyst firm G2 Crowd attest the excellency of the StyleBI data platform and the eminent support services that are provided with it. In a recent comparison, StyleBI beat Plecto in a majority of G2 Crowd ratings....
Infrastructure Optimization Scorecards - Basically, companies are all looking at not only just measurements, but also a roadmap to improve strategic initiatives. What bothers me a lot is this idea that you have a strategy and the bosses go away for a weekend and they come back and say, now figure out how to improve the performance. You go and produce performance stuff and magic happens in between. There are many people out there who feel like that's how it is. So, I think you need to go down to the next level below that and look at the current design. Maybe it hasn't been designed, or maybe it has evolved like anything else, just evolution. From the current state of the design, often called the 'as is' stage, what would you like it to be like three or four years down the road? The 'as is' and the 'to be' stages need to figure out a transformation roadmap of how to get there. Also, people need to understand and know it's about just keeping it simple and just reminding yourself to keep it simple. So I was always trying to think about putting those pieces together...
Ingredients for a Performance Management System to Succeed - This presentation is really going to talk about three things. What are the necessary ingredients for a performance management system to succeed? What are the challenges that you face as you build a management system like this and what are some best practices that you can take home with you on Monday morning and apply? I also like to start with the quote that I think captures the essence of a performance management system. And I’m going to talk about both performance planning and management systems, and I’ll share with you as we go a little bit further along why I think it’s important to link those two into an integrated system rather than treat them as separate ones. Here is the first part of the quote, we’re working so hard to make sure that the right things are done right. What is that? You know, that’s about tactics and operations and processes and efficiency. It’s the measure of are we doing well with the tasks that we have set about for ourselves to do...
Inspiration for Artificial Neural Networks - In this article, continuing our introduction to machine learning, I am going to write a little bit about real neurons and the real brain which provide the inspiration for the artificial neural networks that we are striving to learn about in this series of articles. In most of the discussion, we won't talk much about real neurons, but I wanted to give you a quick overview at the beginning. There are several different reasons to study how networks of neurons can compute things. The first is to understand how the brain actually works. You might think we could do just by experiments on the brain, but it's very big and complicated, and it dies when you poke around it too much. And so we need to use computer simulations to help us understand what we are discovering in empirical studies. The second reason is to understand a style of parallel computation that's inspired by the fact that the brain can compute with a big parallel network available from real neurons. If we can understand that style of parallel computation we might be able to make better parallel computers...

Integrate, Report, and Analyze Data Any Way You Want - Well let’s create a globally consistent way to integrate, report and analyze data and then just open up lots of local franchises throughout the company in either the sales, service, marketing, HR, finance or some of the different lines of business units. And then by bringing it to the local market it’s going to be more responsive. It’s going to have more domain expertise, but there is still a sort of global consistency. So that might be more right for a more centralized self-service BI approach. Now I have seen other folks, and a lot of manufacturers come to mind who tend to be very decentralized, base their BI strategy upon lines of business units. They wanted to be even more decentralized, and they almost had what I would almost view as a bottoms-up approach where essentially the different departments get to do whatever they want. They can integrate, report and analyze data any way they want, and they had full autonomy and full control. And the job of the centralized team is really just to kind of watch what the decentralized teams are doing, and when they are doing something really useful, identify that and promote that, and disseminate that out to the other departments and say hey, this team over here is doing something really cool, let’s make this more widely available to other aspects of our enterprise...
Integrated Data Solution - Let's talk about the benefit of integrated data solutions like InetSoft. Certainly, I've talked a lot about that in different webinars. Now we're seeing the whole field data preparation and data pipelines, what it takes from the process of collecting the data to transforming it and really preparing it properly so the users can work with it. We are seeing this starting to tighten up integration with BI and analytics systems as in our platform. This is important again to support self-service and help users get moving faster. Backing out a little bit, let's talk about the priority issues in this process of democratization and moving out to different kinds of nontechnical users and embedding things into their business applications and business processes. The three big things really are context, I mentioned a minute ago, in context recommendations. Well context really across the board is very important as you move into business processes because this is no longer a standalone decision support system. We're talking about how can we personalize insights to ensure their relevance to make sure the insights are actionable? Autonomy is very important. Make data discovery easier for users. I mentioned again before that they're seeing automation and embedded analytics functionality aimed at this to actually make the self-service BI experience better, so that users can do more in a self-service way...

Interact More with the Data in Terms of Analytics - Interact more with the data in terms of analytics. As more and more users in the organization start thinking about building predictive models and trying to work with the data and look at different levels of the data, particularly, if they're looking at a dashboard and want to dive in and understand some of the metrics that they're taking to look at. In early stages of embedded data analytics, that really wasn't possible. That was something where you had to go back to IT and try to develop something that they can work with. Now we're starting to see more of that kind of ad hoc querying capability moving into the embedded reporting systems which is definitely a good trend. Think again about the nontechnical user being able to self-serve their reporting, how they can receive analytic insights. How is that done? How do they do it if they're not actually building predictive models or working with analytics themselves? How can they receive those insights so that they're in context? As I mentioned before, that they have to be understandable so they're actionable. If they're built off of a predictive model what does this mean for their particular area of interest, their responsibility, their business process? The ability to perform self-service analytics is through that query and search capabilities, so forth. That's obviously very broad idea of what it is all about...
Interactive Reports Detailing the Law Firm’s Performance - So, by the end of the meeting that I had with John, which went for longer than a half an hour, in the end, because he got so excited looking at the interactive reports detailing the law firm’s performance numbers for the quarter. But he said don’t send the hard copies to James. He is very computer literate. Send him an electronic copy. I’ll send him in an email and tell him to expect it. He’ll get it straightaway. He was just blown away by the whole thing, and so was I. I just hadn’t expected that, to see a change in the guy that I know quite well. And he’s a really good guy. And for him to go from hard copy to clicking with a mouse, that was just amazing. And I ran downstairs and told the guy who had been developing the BI system. And I told the story a few times because it really was amazing. I guess you had to be there to see the change in the guy. And it’s been really interesting to see the adoption across the whole firm. The partners have not typically been hands-on managers. They have viewed it as someone else’s problem to run the business or to be worried about the profit. And now all of a sudden, I think, because the performance reporting is so easy to get to, they have a new attitude. It has also helped that we’ve structurally divided the firm into smaller more manageable groups. Mark: It’s been interesting to see how those reports work in your environment. Can you step back a little now and share some of the lessons you’ve learned having done all this. What advice you might want to share with other people..
Interdependencies In Performance Management - Now I want you to think about these interdependencies in performance management. You might be really good at doing the things that make your work experience rich and rewarding, good pay, good benefits, flexible hours, and telecommuting. Well does that quality of life in anyway influence how well you do and attracting an employee? You bet. Well does the quality of the employee you are attracting in anyway influence how you choose to train and develop help them? And doesn’t that influence their quality of life? Do you see the synergy, folks? So the challenge to you, and what I want you to think about, when creating your balanced scorecard, try to create a model so that you can begin to see performance interdependencies. Then you can use your performance measures as tools to break down barriers to cooperation and collaboration between functional divisions rather than reinforce barriers to cooperation and collaboration. Is everybody following me on this. Are silos something you are talking about in your organization? Do you think there’s any silo thinking in your organization? Are there any egos there? I guarantee you got some silo thinking. Well I am going quickly. Questions on that, folks...
Intro to Machine Learning and Some Examples - Today I wanted to write an article to talk about a topic of growing popularity in the business intelligence market: machine learning. Why do we need machine learning? What are the kinds of things we use it for? What are some examples of what machine learning can do? The reason we need machine learning is that there are some problems where it's very hard to write software program to solve. Take recognizing a three-dimensional object, for example. When it's from a novel viewpoint in new lighting conditions in a cluttered scene, it is very hard to do for a non-human system. We didn't know what program to write because we didn't know how it's done in our brain. And even if we did know what program to write it might be that it was a horrendously complicated program. Another example is detecting a fraudulent credit card transaction where there may not be any nice simple rules that will tell you it's fraudulent. You would need to combine a very large number of not very reliable rules, and also those rules change over time because people change the tricks they use for fraud. So we need a complicated program that combines unreliable rules, and those rules need to be changed easily...
Is Big Data Unstructured? - Big data refers to large volumes of data that are too large or complex to be processed and analyzed using traditional data processing tools. The emergence of big data as a recognized area of study arrived in the context of massive data sets provided by online social activities such as those facilitated by Facebook and Twitter and other social media, but was recognized to also describe the data challenges faced in many other disciplines, such as finance, climate analysis, genomics, communications, and so on. Structured data is data that is organized in a specific format, such as a table in a database or a spreadsheet. It is typically easy to process and analyze because it is organized in a way that is easy for computers to understand. Unstructured data, on the other hand, does not have a predetermined format and may include text, images, audio, and video. It is often more difficult to process and analyze because it does not fit neatly into a structured format...
Jaspersoft Competitor: InetSoft, Comparing Solutions Summary - TIBCO Jaspersoft BI Enterprise Edition (referred to as "Jaspersoft" hereafter) is a competitive alternative to InetSoft's reporting sub-product, Style Report Enterprise, but not its all-inclusive data intelligence platform, StyleBI, or the dashboard and visual analytics sub-product, StyleBI. Jaspersoft's application offers strong pixel-perfect, paginated reporting functionality similar to InetSoft's, but for web-based dashboards the capabilities are quite primitive. Jaspersoft can be viewed as an enhancement to the JasperReports paginated report application. For web based visualizations, Jaspersoft renders reports as elements. This architecture severely limits advanced visualization and its associated data preparation...
Java Application Monitoring and Alerting - Java's ease of use and cross-platform compatibility make it a go-to choice for developers, ensuring high-performance standards for critical web applications requires effective Java performance monitoring practices. However, the challenges of poor application performance can be a major headache for developers and IT managers. Enter real-time monitoring and alerting. It helps developers measure performance and detect issues that may impact user experience. This article explores the real-time monitoring and alerting for Java applications: What is real-time monitoring and alerting in Java applications Why is it important for your Java applications? How you can use it to improve your application performance Tips for developing a solid monitoring plan...
Java Based Performance Management - InetSoft's Java based performance management software provides unique capabilities for data mashups, allowing you to combine disparate data sources for a single view of corporate performance. The platform offers quick deployment of easy to use dashboards, scorecards, and reports...
Java Performance Management - InetSoft's performance management software is a Java-based server application for delivering web-based interactive dashboards and scorecards, in addition to sophisticated and flexible reporting. From InetSoft's inception the mission has remained the same: deliver BI software products that are easy, agile and robust...
Join Types - This article will explore the different types of joins that can be used for accessing database tables, and will explain how to implement these joins in the InetSoft application. In database theory, a join is a method of combining data from multiple tables while enforcing a constraint on the data. The nature of the constraint determines the type of join. The following sections explore the various join types and join constraints. The join of two database tables, A and B, can be thought of theoretically as comprising two steps: Form the Cartesian product (or Cross Join) of table A and table B, keeping all columns from both tables. The cross join is the combination of every row in Table A with every row in Table B, which results in a new table that has size length(A)*length(B). Remove every row that does not meet the specified join constraint. Note that from an implementation perspective, performing the above steps (in particular, forming the cross join) is not computationally efficient, and database software uses more efficient algorithms to do this. However, the steps above are useful for conveying the theoretical basis of joins, and for facilitating explanation of join types...
Key Metrics Software - Also known as a key performance indicator, or KPI, a key metric is a statistic which, by its value gives a measure of an organization's or department's overall health and performance. All organizations, from nonprofits to multinational corporations, need to track key metrics in order to have an accurate picture of what is going on. Simply looking at key metrics can give a reading of an organization that would otherwise require sophisticated analysis of large amounts of data...

Key Performance Indicators Analysis Tool - Are you looking for the best key performance indicators analysis tools? Since 1996 InetSoft has been making BI software that is easy to deploy and easy to use. Build self-service oriented dashboards and visual analyses quickly. InetSoft's data mashup engine solves the data access and transformation challenges that other tools cannot. View a demo and download one of our applications for free...
Key Performace Indicators (KPI's) Dashboards - The best way to capture KPI's is through dashboard software. InetSoft's dashboards leverage KPI's by providing a dynamic, easy to understand visual display of an organizations most important metrics. Once an organization has selected their most crucial KPI's, InetSoft's dashboards will present each one in the best possible way. Nonetheless, each dashboard is fully customizable and easy to manipulate. Now, bare data turns into insightful and actionable information...
Key Performance Indicators For Mental Health Services - The use of key performance indicators (KPIs) is crucial for assessing the effectiveness of mental health care. They provide a quantitative and unbiased tool to monitor development and identify potential areas for growth. KPI measurement may assist mental health providers maximize revenue, optimize resource use, and enhance patient outcomes. Key performance metrics for mental health care will be covered in this article. Patient Engagement Patient involvement is a critical KPI for mental health treatment. Patient engagement is the degree to which people are involved and take part in their medical care. Engaged patients are more likely to adhere to treatment regimens, produce greater results, and report higher levels of satisfaction. In order to evaluate the success of their treatment strategies, mental health providers must monitor patient participation...
Key Performance Indicators Software - Looking for key performance indicators software? Since 1996 InetSoft has been making KPI dashboard software that is easy to deploy and easy to use. Build self-service oriented dashboards quickly. View a demo and read customer reviews...
Key Performance Measures in Government - You know how too often there is still a disconnect between what employees are doing daily and what is the right key performance measure to be watching at the strategic level. We really want to bring those two pieces together. I want to share with you what the recent mindset has been in some government agencies. Here’s a quote from someone I talked to: "My boss really wants us to start measuring something, but he doesn’t believe in strategic planning. He says it’s a waste of time." I am not going to say what agency it was or who said it, but I just think it's still remarkable that after all this time many people and especially some people in leadership positions are not putting planning and measurements together. In fact, they are still really just counting things, and I think we all understand that just counting is not performance management...
Key Performance Metrics to Benchmark Against - But in these cases where you don’t know which key performance metrics to benchmark against, one thing you can do is to look not only in this country but abroad as well. If you are working in an area where you can’t find a private or public peer who is doing what you are doing, or measuring what you are measuring, then look to some of the foreign countries abroad. We have been working with countries including Germany, China, Spain, Italy and others and taking a look at their measures and they in some instances specifically in Europe and they have gone farther in performance measurement than we have. So that is something to keep an eye on...
Keyword Search Tools - BI search is essentially a keyword search tool that kicks off dynamic queries for their reporting tools and OLAP tools. BI search and data mashup are really the way casual users are going to be doing ad hoc navigation analytics so to speak. That’s why I have it connected by that green line. Now if you move up on the data volume side, you will see connected by red lines are various tools that are categorized as ad hoc tools for power users. And that includes your traditional ad hoc query and reporting tools that have been around for a while as well as new visual discovery tools that provide “speed of thought” analysis and very interactive charting and visualization on a predefined data set for the most part...
Knowledge Driven Performance Management - In corporate performance management, there's a huge knowledge asset that is available within organizations that's now available on the internet and over the web as well. There is a wonderful opportunity to enhance corporate performance management initiatives by linking it with those knowledge assets in order to really empower the people to do a more effective job for themselves, their teams, and organizations...

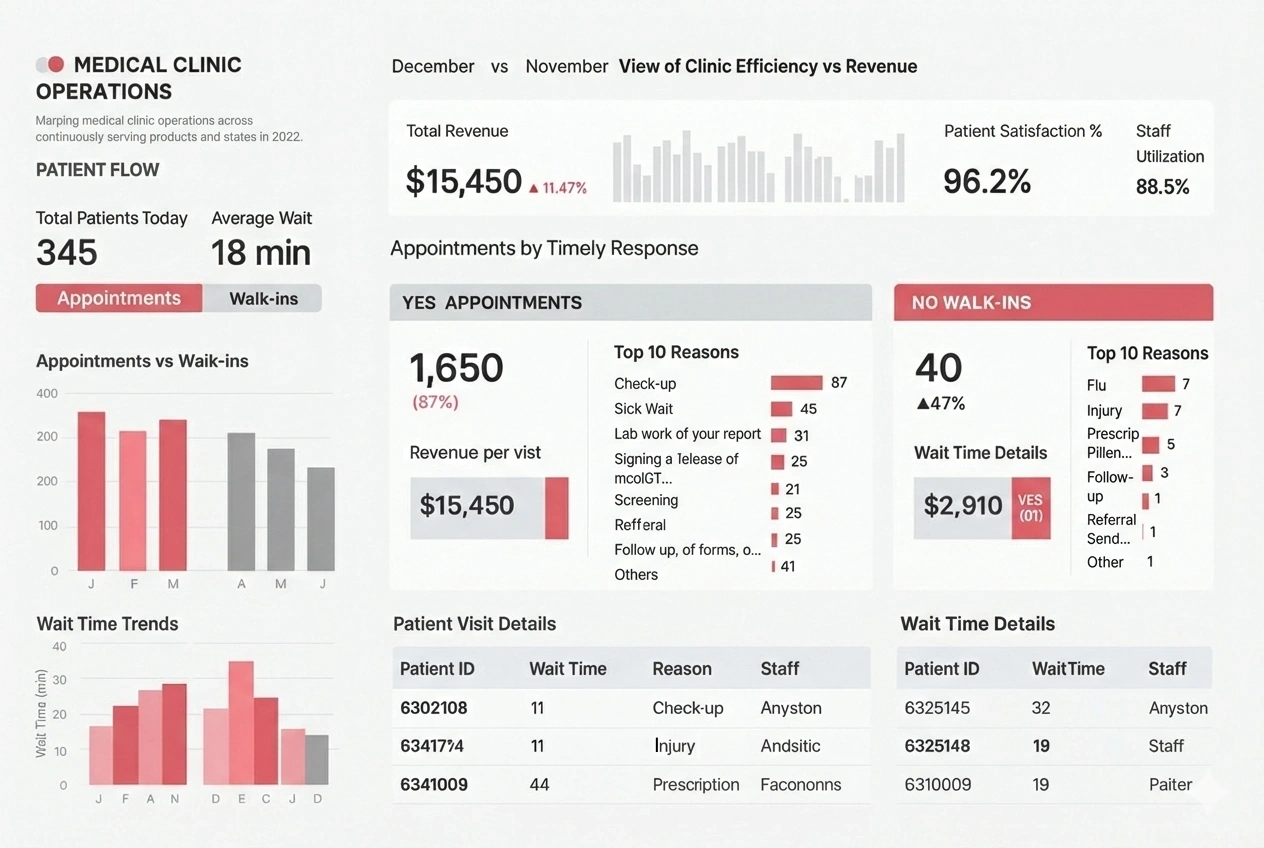
KPI Dashboard Examples - Looking for examples of KPI Dashboards? InetSoft's dashboarding solution allows end-users to create highly interactive dashboards. Find samples of dashboards reporting KPIs in the examples below...
Lack of Measuring Ethics and Corporate Culture - A very important part of any and all organizations is ethics and culture. These two qualities are also considered to be the two easily overlooked. Number two, nobody is measuring ethics or their corporate culture. We all know that by the time your executives get carried away in handcuffs you don’t need any metrics. Your CEO is in jail so you know you have a problem with ethics but do you think that there could have been some things that a company, like Enron, could have measured before they got into big trouble? What could they have measured that would have told them we’re having a little bit of an ethics problem before people got arrested? How about minor cheating like somebody cheating on their expense report or somebody calls in sick while he/she wasn’t really sick? Ethics problems usually happen where they escalate. It starts out with something small, like charging a $100 bottle wine in his expense report and the boss approves it and nobody says anything. From there it escalates, it escalates, it escalates, and pretty soon we’re falsifying financial data...