Key Performance Indicators Dashboards
Key Performance Indicators (KPI's) are business metrics used to track an organization's performance and determine whether business goals are being met.
Every industry, agency, or organization must measure its performance on a daily, monthly, or quarterly basis to ensure health and sustainability.
The best way to capture KPI's is through dashboard software. InetSoft's dashboards leverage KPI's by providing a dynamic, easy to understand visual display of an organizations most important metrics.
InetSoft's dashboards are channels for all end users to focus on the information and measures that are most crucial to them.
For example, it is important to know how much sales for the quarter are, but what if a manager needed to choose a sales person to make a pitch? With InetSoft's drill down capabilities, users can quickly spot who had the best sales consistently, or even compare quality of sales.


KPI Applications
Once an organization has selected their most crucial KPI's, InetSoft's dashboards will present each one in the best possible way. Nonetheless, each dashboard is fully customizable and easy to manipulate. Now, bare data turns into insightful and actionable information.
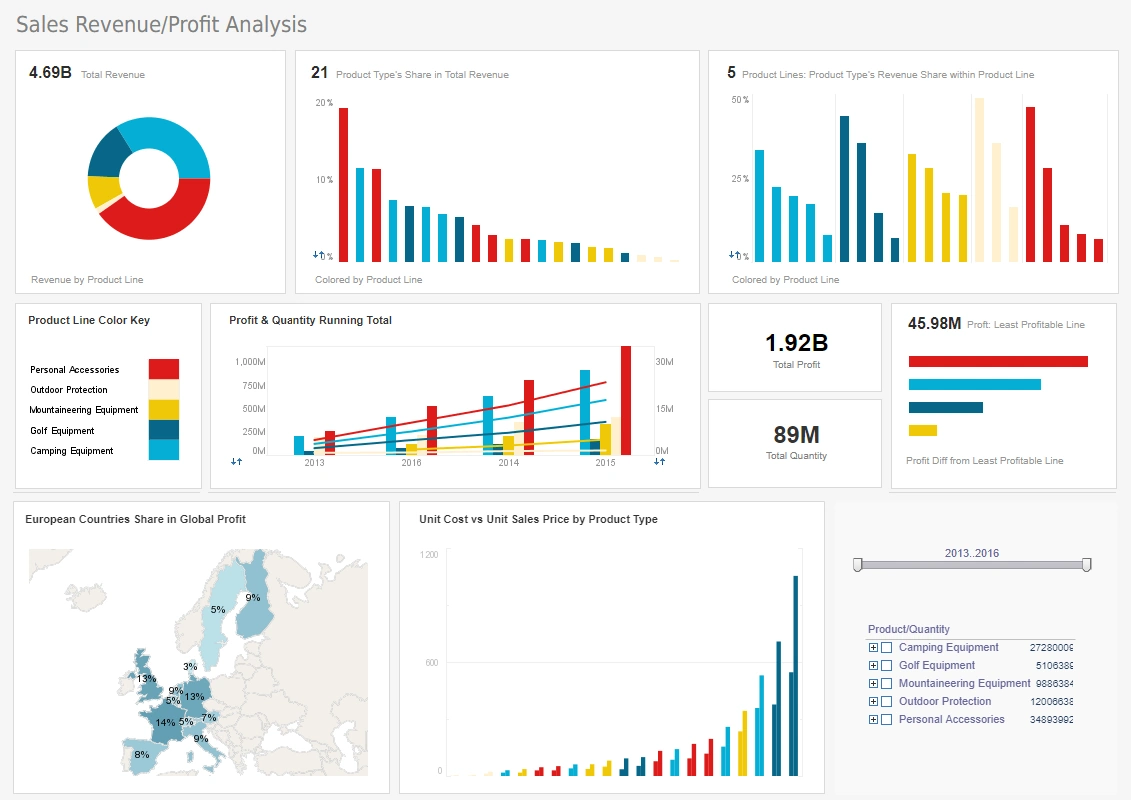
KPI's help organizations quantify their business in traditional and novel ways by providing a deeper understanding of where their business stands, where they can improve, and how. A KPI dashboard could be the difference between succeeding and failing in business as they provide all users with real time information in a way they have not seen before. Visual graphs and pictures help users spot patterns, trends, or even potential problems that a spreadsheet simply could not capture.
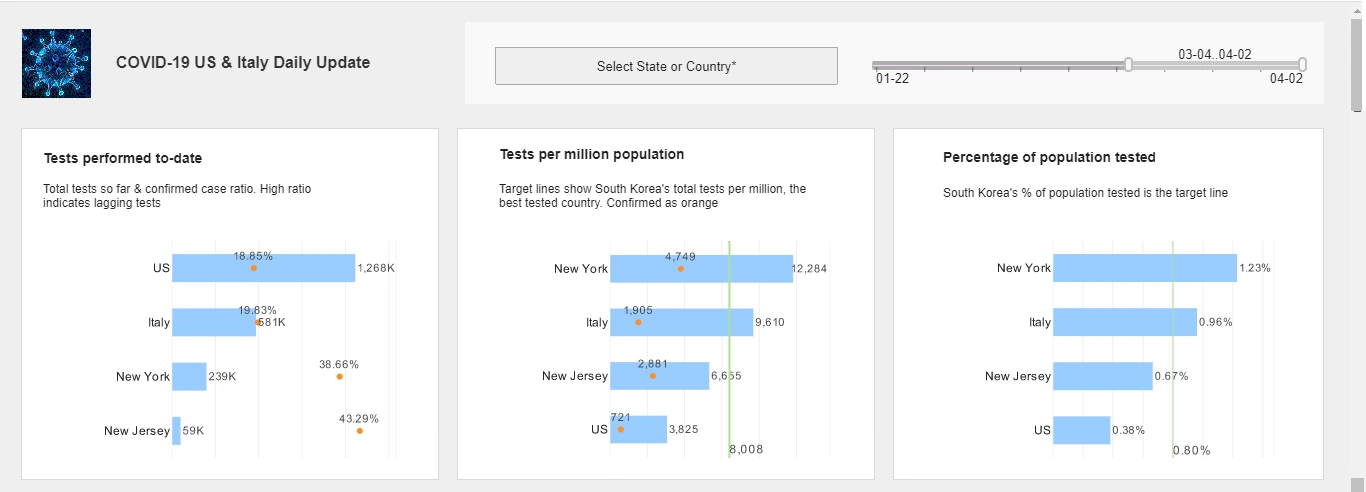
Dashboards allow users to visualize their goals and targets while keeping track of how far or close they are from reaching them. When applied, a KPI dashboard is a powerful tool to bring any organization to a new level of precision and success.
What Is in a Key Performance Indicator Dashboard for 360 Degree Feedback Software?
A Key Performance Indicator (KPI) Dashboard for 360 Degree Feedback Software plays a crucial role in providing a comprehensive view of the performance and effectiveness of the feedback process. This type of dashboard typically includes a range of metrics and indicators that offer insights into various aspects of the 360-degree feedback program. Here's a detailed breakdown of what you might find in such a dashboard:
- Overall Participation Rates:
- Metric: Percentage of employees participating in the 360-degree feedback process.
- Importance: Indicates the level of engagement and the extent to which the organization values and utilizes the feedback process.
- Feedback Completion Rates:
- Metric: Percentage of feedback surveys completed by participants.
- Importance: Reflects the thoroughness of the feedback process and the commitment of participants to providing comprehensive input.
- Feedback Timeliness:
- Metric: Average time taken by participants to complete feedback surveys.
- Importance: Highlights the efficiency of the feedback process and the promptness of participants in submitting their evaluations.
- Distribution of Ratings:
- Metric: Distribution of ratings across various competencies and skills.
- Importance: Offers insights into the strengths and areas for improvement across different aspects of individual and team performance.
- Top Strengths and Development Areas:
- Metric: Identification of the most commonly identified strengths and areas for development.
- Importance: Helps in recognizing and leveraging key strengths while addressing critical development needs.
- Alignment with Organizational Goals:
- Metric: Alignment of individual and team goals with organizational objectives.
- Importance: Ensures that feedback is aligned with the broader strategic goals of the organization, promoting a unified and purposeful workforce.
- Comparison Over Time:
- Metric: Trends in feedback scores and responses over multiple feedback cycles.
- Importance: Allows for the assessment of progress and the impact of developmental initiatives over time.
- Managerial Effectiveness:
- Metric: Evaluation of managers based on feedback from their direct reports, peers, and superiors.
- Importance: Assesses the leadership and managerial capabilities within the organization.
- Feedback Quality and Consistency:
- Metric: Assessment of the quality and consistency of feedback provided.
- Importance: Ensures that the feedback gathered is meaningful, constructive, and consistent across different evaluators.
- Training and Development Needs:
- Metric: Identification of common themes and areas requiring additional training or development initiatives.
- Importance: Guides the organization in tailoring training programs to address specific skill gaps and development needs.

More Articles for KPI Dashboard Users
Accuracy and Timeliness KPIs - Billing Accuracy Rate Percentage of accurate invoices generated within a specified timeframe. Helps assess the precision of billing processes and identify potential errors. Invoice Error Rate Measures the frequency of errors in generated invoices. Enables identification of recurring issues and highlights areas for process improvement. Billing Cycle Time Time taken to complete the billing process from start to finish. Helps assess operational efficiency and identifies bottlenecks in the billing workflow...
Data Discovery Software Vendors - InetSoft - Are you looking for data discovery software vendors? Since 1996 InetSoft has been a BI application innovator and its Web-based visualization solution is quickly deployed and easily used. View a demo. Review the resources and articles below for more information: Using data visualization in an organization to monitor progress makes a big impact on unstructured data analysis. They picked up on this and started responding to the Twitter feeds about coming over to...
Incident Response and Resolution SLAs - SLAs, or service level agreements, are essential to incident management. They determine the anticipated response and resolution timelines for various event categories. Dashboards for incident management keep track of and show SLA compliance data, such as the proportion of issues that are addressed within the specified time limit. Organizations may take...

Requirement Validation and Verification - While verification verifies that the criteria are accurately implemented in the product, validation makes sure the requirements match the intended business need. Key KPIs and Analytics: Validation and Verification Time of Cycle: The time required to complete validation and verification tasks is measured by this KPI. Reduced cycle times may be a sign of effective requirement accuracy assurance. Requirement Defect Density: analytics that monitor how many requirements flaws are discovered during verification. Higher required quality is shown by a lower defect density...
Solar Panel Efficiency - The solar panels are the essential component of any solar power producing system. One important KPI that has a direct bearing on the system's overall performance is the efficiency of these panels. The ratio of the panels' energy output to their energy intake from sunlight is known as solar panel efficiency. Real-time data on each panel's efficiency are provided via a solar power generation dashboard, which helps...
Tool to Make Charts Online for Free - To easily and quickly create Gantt Charts online for free, create a Free Individual Account on the InetSoft website. You will then be able to upload a spreadsheet data set, as shown below: Once you have done that, you will be able to proceed past the Visualization Recommender, which can usually get you started creating a dashboard. Since the Recommender does not offer the Gantt Chart as a suggestion, press the Full Editor button... Why Is A Risk Register Important? - /business/bi/creating-risk-register-dashboard/ Besides gathering information about identified risks and hazards, risk registers offer immediate responses and corrective actions to different risk events. They enable a systematic and customized approach to risk management and ensure that any threats are mitigated effectively. Here are the other benefits of a risk register...