Asana Dashboard Software
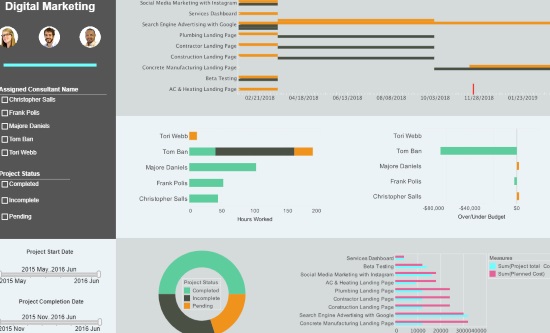
Project managers foremost need project progress and coordination information such as dashboards displaying Gantt charts. However, the dashboards must be able to go beyond core project management data to give a holistic view of all factors that can impact on-time, on-budget delivery.
Asana is a web and mobile application designed to help teams organize, track, and manage their work. InetSoft's StyleBI comes with a custom Asana data connector for incorporating project management data.

Self-Service Asana Dashboards
Set up all of your Asana reports to run automatically, without sacrificing flexibility and control
Visualization dashboards are the most intuitive ways to understand project information. However, not all dashboards are created equal. InetSoft's web app can easily connect to Asana data to create self-service dashboards with rich built-in interactivity and customization.
For successfully delivery of projects, project managers must utilize all project related data, for example, supply chain and issue tracking system data. These systems are normally scattered. Some third party data may even be in Excel files. InetSoft's data mashup makes data processing a light-weight, business user self-serviceable process with great efficiency.
Online and Offline Reports
Make your reports accessible in the office, at home, or in the field.
Project managers interact, share and collaborate with many parties. Visualization dashboards works excellently in most cases. Offline distributable reports become essential for many occasions where parties must share a large amount of information. InetSoft's pixel perfect, paginated document report engine is specifically desigend for these cases.

Data Mashup and Drilldown - Flexible Automated Reporting
Give your user's the power to discover new insights into your company's data
With StyleBI, you won't have to run redundant reports because of limited data access. InetSoft's solution can mashup data from many diverse sources in real time, giving you maximum flexibility in report generation.
Reports can also be made interactive with drilldown capability, enabling managers to find further insights in the data. Certain patterns or thresholds in the data can be set to trigger automated alerts, ensuring that certain conditions do not escape the reader's attention.
About InetSoft
Since 1996 InetSoft has been delivering easy, agile, and robust business intelligence tools that make it possible for organizations and solution providers of all sizes to deploy or embed full-featured business intelligence solutions. Application highlights include visually-compelling and interactive dashboards that ensure greater end-user adoption plus pixel-perfect report generation, scheduling, and bursting.
InetSoft's patent pending Data Block™ technology enables productive reuse of queries and a unique capability for end-user defined data mashup. This capability combined with efficient information access enabled by InetSoft's visual analysis technologies allows maximum self-service that benefits the average business user, the IT administrator, and the developer. InetSoft solutions have been deployed at over 5,000 organizations worldwide, including 25% of Fortune 500 companies, spanning all types of industries.
KPIs and Metrics in Asana Dashboards: Definitions and Significance
Asana is a popular project management tool that helps teams organize, track, and manage their work. The platform offers a variety of features, including task assignments, project timelines, and detailed reporting, making it a powerful solution for performance management. Central to Asana's capabilities are its dashboards, which provide a visual representation of key performance indicators (KPIs) and metrics. These KPIs and metrics are crucial for monitoring progress, identifying bottlenecks, and ensuring that projects stay on track. This essay delves into the KPIs and metrics tracked in Asana dashboards, their definitions, and their significance in performance management.
1. Task Completion Rate
Definition: Task completion rate measures the percentage of tasks completed out of the total tasks assigned within a specific period.
Significance: This KPI is essential for understanding team productivity and efficiency. A high task completion rate indicates that the team is performing well and meeting deadlines, while a low rate may suggest issues such as workload imbalances, resource shortages, or other barriers to task completion. Monitoring this metric helps managers identify areas where additional support or adjustments may be needed to improve performance.
2. Task Overdue Rate
Definition: Task overdue rate represents the percentage of tasks that are not completed by their due dates.
Significance: High overdue rates can signal potential problems in project management, such as unrealistic deadlines, insufficient resources, or inadequate planning. By tracking this metric, managers can take proactive measures to address these issues, such as reallocating resources, adjusting timelines, or providing additional training and support to the team.
3. Task Assignment Distribution
Definition: Task assignment distribution tracks the allocation of tasks among team members.
Significance: Ensuring an equitable distribution of tasks is vital for maintaining team morale and preventing burnout. This metric helps managers identify if any team members are overloaded or underutilized. Balanced task distribution fosters a collaborative work environment and enhances overall team productivity.
4. Project Progress
Definition: Project progress measures the percentage of tasks completed within a project relative to the total number of tasks.
Significance: This KPI provides a snapshot of the project's current status, enabling managers to gauge whether the project is on track to meet its deadlines. It helps in identifying any delays early on, allowing for timely interventions to keep the project on schedule.
5. Time to Completion
Definition: Time to completion tracks the average time taken to complete tasks or projects.
Significance: This metric is critical for evaluating the efficiency of workflows and processes. By analyzing time to completion, managers can identify bottlenecks and areas where processes can be streamlined. It also aids in setting realistic deadlines and improving project planning.
6. Task Dependency Tracking
Definition: Task dependency tracking monitors the relationships between tasks, identifying which tasks are dependent on the completion of others.
Significance: Understanding task dependencies is crucial for effective project planning and execution. This metric helps managers ensure that dependent tasks are prioritized appropriately, minimizing delays and ensuring a smooth workflow.
7. Milestone Achievement Rate
Definition: Milestone achievement rate measures the percentage of project milestones reached on or before their scheduled dates.
Significance: Milestones are critical points in a project that signify significant progress. Tracking milestone achievement helps managers assess whether the project is progressing as planned and whether any adjustments are needed to stay on track.
8. Workload Balance
Definition: Workload balance evaluates the distribution of work among team members over time.
Significance: Maintaining a balanced workload is essential for preventing burnout and ensuring sustainable productivity. This metric helps managers identify any imbalances and redistribute tasks as necessary to maintain a healthy work environment.
9. Collaboration Metrics
Definition: Collaboration metrics assess the level of interaction and cooperation among team members, such as the number of comments, file shares, and meetings.
Significance: High levels of collaboration often correlate with better project outcomes. Tracking collaboration metrics helps managers foster a collaborative culture, identify communication gaps, and ensure that team members are effectively working together.
10. Task Prioritization
Definition: Task prioritization measures the effectiveness of prioritizing tasks based on their importance and urgency.
Significance: Effective prioritization ensures that critical tasks are completed first, optimizing resource use and minimizing delays. This metric helps managers assess whether tasks are being prioritized correctly and make adjustments if necessary.
11. Issue Resolution Time
Definition: Issue resolution time tracks the average time taken to resolve project-related issues.
Significance: Quick issue resolution is vital for maintaining project momentum and preventing minor problems from escalating. This metric helps managers identify any delays in addressing issues and improve the responsiveness of the team.
12. Resource Utilization
Definition: Resource utilization measures how effectively the project's resources, such as time, budget, and personnel, are being used.
Significance: Optimal resource utilization ensures that the project stays within budget and is completed efficiently. This metric helps managers identify areas where resources may be over or underutilized and make necessary adjustments.
13. Budget Variance
Definition: Budget variance tracks the difference between the planned budget and the actual expenditure.
Significance: Keeping projects within budget is critical for financial management and project success. This metric helps managers monitor spending, identify cost overruns, and take corrective actions to stay on budget.
14. Customer Satisfaction
Definition: Customer satisfaction measures the level of satisfaction of stakeholders or clients with the project's outcomes.
Significance: High customer satisfaction is a key indicator of project success and can lead to repeat business and positive referrals. This metric helps managers understand the effectiveness of their work and identify areas for improvement.
15. Risk Management
Definition: Risk management tracks the identification, assessment, and mitigation of project risks.
Significance: Effective risk management minimizes the impact of potential issues on the project. This metric helps managers proactively address risks and ensure the project's smooth progression.
16. Team Member Performance
Definition: Team member performance measures individual contributions to the project, including task completion rates, adherence to deadlines, and quality of work.
Significance: Tracking individual performance helps managers recognize high performers, provide targeted feedback, and identify areas where additional support or training may be needed. This metric is essential for maintaining a motivated and productive team.
17. Quality Metrics
Definition: Quality metrics assess the adherence to project standards and the quality of deliverables.
Significance: Ensuring high-quality deliverables is critical for project success and customer satisfaction. This metric helps managers monitor the quality of work and implement improvements as needed.
18. Change Request Tracking
Definition: Change request tracking monitors the number and nature of changes requested during the project.
Significance: Frequent change requests can indicate issues with initial project planning or scope definition. This metric helps managers understand the impact of changes on the project timeline and budget and manage scope creep effectively.
19. Stakeholder Engagement
Definition: Stakeholder engagement measures the level of involvement and satisfaction of stakeholders throughout the project.
Significance: Engaged stakeholders are more likely to support the project and provide valuable feedback. This metric helps managers ensure that stakeholders are kept informed and involved, enhancing the project's chances of success.
20. Task Reopen Rate
Definition: Task reopen rate measures the percentage of tasks that need to be reopened after being marked as complete.
Significance: A high task reopen rate can indicate issues with task execution or quality control. This metric helps managers identify areas where additional training or process improvements are needed to ensure tasks are completed correctly the first time.
More Articles About Dashboards
Automated Reporting Software Features - As a 100% web-based reporting platform, StyleBI brings powerful and user-friendly tools to the table. Ideal for all organizations, this solution combines effectiveness, efficiency, and relevancy to bring your organization the right solution to your needs and wants...
Automated Reporting Tools Help - Create easy to manipulate and read graphics for reports Produce reports in large volumes to satisfy needs and wants Build interactive charting and dashboard software Eliminate pesky errors...
Definition of Operational Data Architecture - Data architecture is the foundation of any organization's data management strategy, and it plays a crucial role in ensuring that data is accurate, consistent, and accessible. In recent years, there has been a significant shift in focus towards managing data for analytics, while operational data has often been considered as mere source data for analytics...
Embedded Decision Support Systems - Again, a lot of embedded decision support systems in earlier days were not really well equipped for that. They were too static or kind of simple. It might've been reports or static dashboards, and so this is a revolution that is having to occur in those kinds of embedded systems as well, how to supply them with the kinds of data interaction capabilities, the visualization capabilities, the ability to bring systems up more quickly so that you can meet those dynamic business needs...