Interested in Using BI and Analytics?
Many business owners and executives have access to large amounts of accumulated business data. But when it comes to actually turning data into insights that help steer organizational direction, many find themselves at a loss for where to begin.
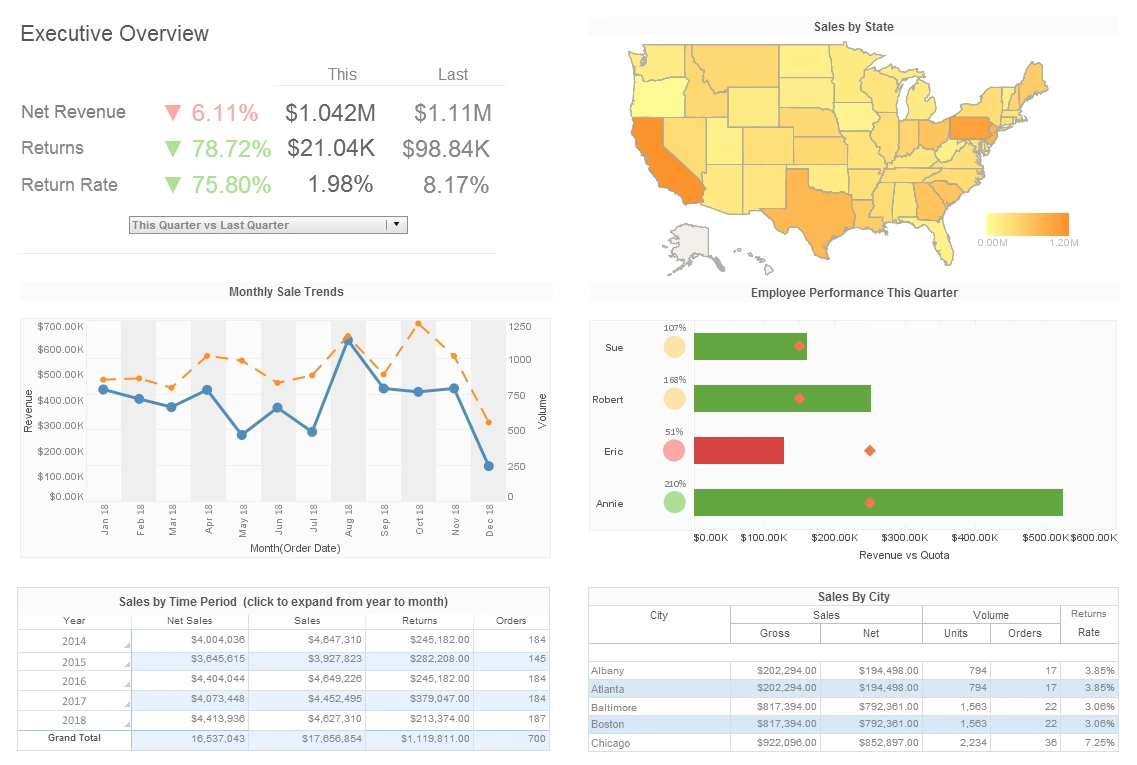
Enter StyleBI, a complete BI solution for interactive dashboards and reporting, recently rated number one by Butler Analytics among enterprise business platforms. InetSoft offers organizations an easy, hassle-free solution to creating in-depth and concise analytics for all of their accumulated and live data, whatever the data sources may be.
InetSoft’s StyleBI provides non-technical users access to a robust, yet intuitive interface that allows them to create high-quality and effective visual analytics of business data. Using StyleBI guarantees effective and efficient methods for creating interactive dashboards and reports, featuring graphs, charts and other visual aids that allow optimal reviewing and analysis of data for any business or organization.


Choose InetSoft for Easy, Effective Analytics
For those who want to visually explore their data without getting into coding and scripting, Style Intelligence allows users to drag and drop data fields into a wide-range of sophisticated charts and graphs. It's simple, non technical interface gives users the power to construct meaningful information from their business data without any experience or IT support.
The simple drag and drop flexibility of the InetSoft viewsheet allows for a more sophisticated analysis through the use of unlimited multi-dimensional charting. Unlike classic charts that only factor in two dimensions, multidimensional visualizations analyze data along a variety of measures, such as color, shape, size, allowing for a more detailed and sophisticated visualization.
These communicative visuals, combined with the ability to filter data quickly through selection boxes and sliders, encourage creative, independent analysis and trend recognition, leading to better, more informed decision-making. To further enhance this analytical flexibility, InetSoft's data worksheet gives users the ability to combine data from many different data source types using similar drag and drop functionality.
The data worksheet also can also reformat live data and add calculated fields, removing the need for the maintenance of a single consolidated data source. With StyleBI's flexibility through data mashup, dashboards and reports can be built which pull live data from sources like Hadoop/HIVE, SAP ERP, Microsoft Excel, and Google Adwords and Analytics, just to name a few.
Case Study: Enhancing Operational Efficiency in Nautical Equipment Manufacturing with BI Analytics Software
BlueWave Marine Technologies (BMT) is a leading manufacturer of nautical equipment, specializing in advanced navigation systems, marine communication devices, and safety equipment for the maritime industry. Founded in 1985, BMT has established itself as a trusted partner for commercial shipping companies, naval fleets, and recreational boating enthusiasts.
Challenge: As BMT grew, it faced increasing complexity in its operations, from managing supply chains to ensuring quality control and meeting delivery deadlines. The company realized that to maintain its competitive edge, it needed to harness the power of data analytics to streamline processes, improve decision-making, and enhance overall operational efficiency.
Solution: BMT decided to implement a Business Intelligence (BI) analytics software suite to integrate and analyze data from various sources across the organization. After evaluating several options, the company chose InetSoft's data mashup tool for its flexibility, user-friendly interface, and robust analytical capabilities.
Implementation: The implementation of the BI analytics software was carried out in several phases:
- Data Integration:
- InetSoft's data mashup tool was used to integrate data from multiple sources, including ERP systems, CRM platforms, manufacturing execution systems (MES), and supply chain management (SCM) software. This integration allowed BMT to create a unified data repository for comprehensive analysis.
- Dashboard Creation:
- Custom dashboards were developed to provide real-time insights into key performance indicators (KPIs) such as production efficiency, inventory levels, order fulfillment rates, and quality control metrics. These dashboards were accessible to different departments, enabling a collaborative approach to problem-solving.
- Predictive Analytics:
- Advanced predictive analytics models were built to forecast demand, optimize inventory management, and predict potential equipment failures. This proactive approach helped BMT reduce downtime and improve customer satisfaction by ensuring timely delivery of products.
- Training and Adoption:
- Extensive training sessions were conducted to ensure that employees across all levels were comfortable using the new BI tools. This training emphasized the importance of data-driven decision-making and how it could enhance their daily operations.
Results:
- Improved Operational Efficiency:
- By leveraging real-time data, BMT was able to identify bottlenecks in the production process and implement corrective measures promptly. This led to a 20% increase in manufacturing efficiency and a 15% reduction in production costs.
- Enhanced Quality Control:
- The BI analytics software enabled BMT to track quality metrics more effectively, leading to a 25% reduction in defective products. This improvement in quality control not only enhanced customer satisfaction but also reduced warranty claims and associated costs.
- Optimized Inventory Management:
- Predictive analytics helped BMT optimize inventory levels, reducing excess stock and minimizing stockouts. This optimization resulted in a 30% decrease in inventory holding costs and improved cash flow.
- Informed Decision-Making:
- The intuitive dashboards and real-time reporting provided managers with the insights needed to make informed decisions quickly. This agility allowed BMT to respond swiftly to market changes and customer demands, strengthening its market position.
- Increased Revenue:
- The combination of improved efficiency, enhanced quality control, and optimized inventory management contributed to a 12% increase in annual revenue. Additionally, customer satisfaction scores improved, leading to higher customer retention rates.

More Resources About BI Analytics
Automated Statutory Reporting with InetSoft's Report Scheduler - With InetSoft's report scheduler, users can set reports to automatically run at regular intervals, or be triggered by business conditions. When a weekly, monthly, or annual report is created, it can be set not only to run at whatever desired interval, but also can be automatically exported to its recipients...
Bring SaaS BI to Your Data - Bringing the software to the data, not the data to the software, is a proven winning formula in BI. Data tends to quickly increase in volume, variety, and velocity. Moving the data to the software will become a bigger and bigger challenge as you grow. Even when data movement is not yet an insurmountable issue, users are limited by how frequently data can be refreshed and will pay a performance penalty if directly querying data sources. InetSoft's cloud flexible BI embodies the "bring the software to the data" principle and delivers optimal performance...
Is DIY BI Going to be Too Difficult? - The primary concern most business users have with creating their own dashboards and reports is that the BI program would be too difficult to use for those without the proper skills. Of course, "doing it yourself" without a technical background can make it more difficult to understand the types of data presented, and you may not completely understand the scripting that can be necessary for many BI programs...
How To Preview Data When Building a Live Dashboard - To preview a table, right-click the table title bar, and select 'Preview' from the context menu. This opens the Preview tab, which displays all visible columns of the table. You can only preview one table at a time. In the table preview tab, click the table to see table information, including the record numbers being displayed. Click outside the table to see information about the Worksheet...
Mass Transit Performance Reporting Software - A Compliance Operations Manager in mass transit plays a crucial role in ensuring that the operations of a transit system adhere to all relevant regulations, policies, and industry standards. The use of performance reporting software is integral to effectively carry out these responsibilities. Here's a detailed explanation of how a Compliance Operations Manager can leverage such software...