InetSoft Webinar: Case Study of Event Marketing Analytics
This is the continuation of the transcript of a Webinar hosted by InetSoft on the topic of "How to Implement Business Analytics." The speaker is Abhishek Gupta, product manager at InetSoft.
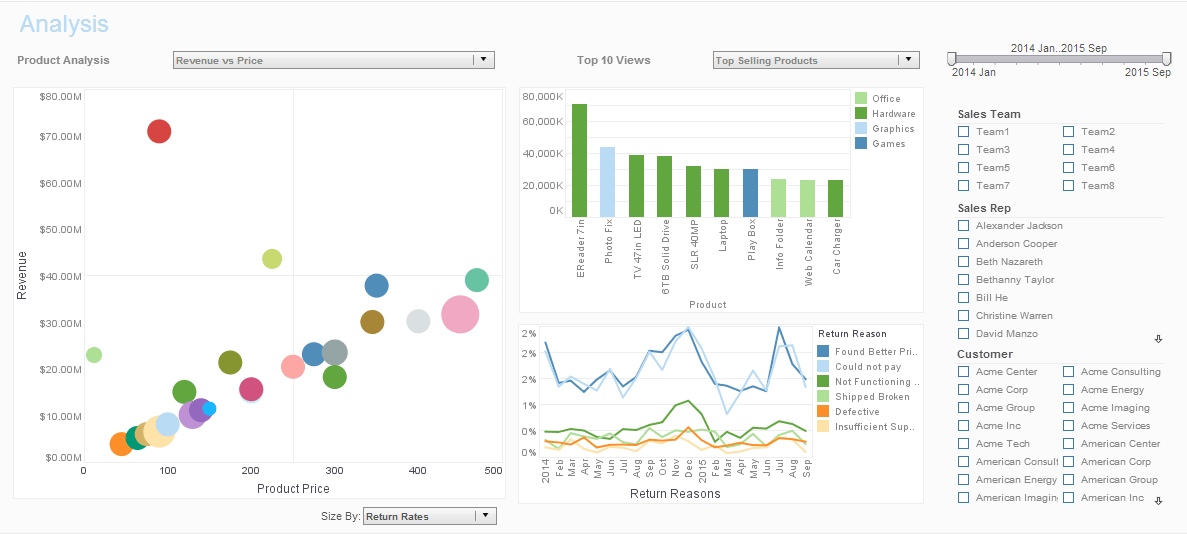
Let me give you an example of event marketing analytics. When you’re planning big conferences you want to understand how many people are registered from what industry and what type of programs. Do you have content to meet all of their needs? So you have a data scientist or a data analyst bring together this information with a BI tool.
It’s a massive amount of data from many sources, and you bring it together, data from registrations, from Twitter about what’s the sentiment of the event, historical information on past events to understand what was successful in the past. You mash it together. The questions that your CMO asks are very different than the questions of the event planner who was setting up the event.

Event Marketing Analytics
The operations people also use that data, but they ask very different questions, and they manipulate that data in very different visualizations. And that’s what I’m talking about. That needs to happen in the future, because the reality is not only do people get involved in data more than they ever have before, but also people’s needs in terms of what they do with data has changed.
So, I ask you all to consider this. Do not just assume that how people use data today will be the same as they do tomorrow. Think about how people use data in their personal lives and what's the ideal way that people are wanting to use data, whether it's to explore questions, whether it's to monitor. A lot of times it's to predict what's going to happen.
It used to be data scientists in backrooms were the ones predicting. But the reality is that is not a way to maintain a business. You have to get the predictive capabilities in the form that is very easy and intuitive for the outer edges of your company: that inventory manager, store manager, a maintenance guy that’s managing a plane that’s got maintenance issues. Everyone needs to predict what's happening next in their business. It can't be a data scientist in the backroom.
So you need to think about these things when you’re trying to figure out the right data, when you’re trying to figure out the right analytical tools for the individual. So this is what we mean by engraining insights into the DNA of your people and processes. How do you make sure that every individual has what they need, and it might change throughout the day. They may need to explore the data to get the answer.
They may need to monitor operational performance. You can design the perfect dashboard and get it out through your entire organization or even give it to your consumers. You need to be able to consider visualization. We never considered visualization as much as we do now. The reality is it is important when it comes to analytics.

Right Information
If you are going to get the right information to your people, whatever your view is, it’s much more about how it’s seen and what that experience is. And then how can you derive unique insights that are going to be important to that person to run their business in real time and not have to sift through a billion records in a non intuitive way but actually have insight to jump out at them.
When they are placing a customer order, they should be able to see if customer has good credit history and what that customer is worth. Then they can know before placing that order that they will pay in the future. The BI applications need to have the right use cases for the specific industry or lines of business. Use cases will not only bring the analytics to the needs of the people but do it in a way that’s very industry specific and very line of business specific.
That way it meets the needs of those people, whether it’s predictive maintenance or fraud detection, predicting customer behavior or demand in your operations and supply chain. All of those analytics need to be wrapped up in a way that meet the needs of those organizations.
So and then you need to change your culture. You have to be a culture of that embraces information in real time, one that absolutely expects people to come in with their iPad. In a live meeting around the conference room everyone shares information in real time to get answers. One example I’d love to give is this huge multinational. They have over 45,000 analytic users, and they use mobile for most of those. They have eight lines of business.
Event Marketing KPIs
Event marketing KPIs measure the success of events by tracking metrics aligned with goals like brand awareness, lead generation, engagement, or revenue. These indicators help optimize strategies, justify investments, and improve future events. Below are 10 critical KPIs with descriptions of their importance.
-
Total Registrations
Tracks the number of people who sign up for the event, indicating initial interest and marketing reach. High registration numbers suggest effective promotional strategies. Analyzing trends over time helps refine marketing efforts.
-
Attendance Rate
Measures the percentage of registered attendees who actually participate, calculated by dividing actual attendees by total registrations. Typical rates are 60-80% for in-person events and 40-60% for virtual ones. This KPI reflects the effectiveness of pre-event engagement.
-
Lead Generation
Counts the number of qualified leads (e.g., Sales Qualified Leads) generated through event activities like networking or booths. Tracking leads helps evaluate the event’s impact on sales pipelines. QR codes or landing pages can streamline lead capture.
-
Return on Investment (ROI)
Compares total revenue (e.g., ticket sales, sponsorships) to event costs to assess financial success. A positive ROI indicates profitability and efficient resource use. This is critical for justifying event budgets to stakeholders.
-
Social Media Engagement
Monitors mentions, hashtags, shares, and likes on platforms to gauge event buzz and brand visibility. High engagement reflects audience interest and amplifies reach. Event-specific hashtags or QR codes can track digital interactions.
-
Attendee Satisfaction
Collected via post-event surveys, this measures satisfaction, intent to return, or Net Promoter Score (NPS). High scores indicate a positive attendee experience, encouraging loyalty. Surveys should be concise to maximize responses.
-
Cost per Lead (CPL)
Calculates the cost of acquiring a lead by dividing total event marketing costs by the number of leads generated. Lower CPL indicates cost-effective strategies. Comparing CPL across channels optimizes budget allocation.
-
Ticket Sales by Type
Tracks sales of different ticket categories (e.g., early bird, VIP) to understand buying patterns and pricing effectiveness. This helps tailor future pricing strategies. Event platforms like Eventbrite simplify tracking by type.
-
Session Engagement
Measures participation in specific sessions via attendance, polls, or Q&A activity, especially for virtual events. High engagement indicates relevant content. Tagging sessions by topic helps identify popular themes.
-
Website Traffic
Monitors increases in website visits during and after the event, using tools like Google Analytics. A spike in traffic (e.g., 50% above average) shows effective event promotion. Unique landing pages can track event-specific visits.
These KPIs align with event goals and provide actionable insights. Use event management platforms like EventsAir or Eventbrite to track metrics in real-time. Regular analysis ensures continuous improvement and stakeholder confidence.