Evaluate InetSoft's Dashboard Analytics Software
Since 1996 InetSoft has been a pioneering provider of dashboard analytics software. Create quick, accurate, and attractive dashboards in minutes by utilizing an intuitive drag-and-drop design that suitable for all users, regardless of technological prowess. IT professionals can take things a step further using the fully featured scripting engine for dashboard creation.


About InetSoft
Since 1996 InetSoft has been delivering easy, agile, and robust business intelligence software that makes it possible for organizations and solution providers of all sizes to deploy or embed full-featured business intelligence solutions.Application highlights include visually-compelling and interactive dashboards that ensure greater end-user adoption plus pixel-perfect report generation, scheduling, and bursting.
InetSoft's patent pending Data Block™ technology enables productive reuse of queries and a unique capability for end-user defined data mashup. This capability combined with efficient information access enabled by InetSoft's visual analysis technologies allows maximum self-service that benefits the average business user, the IT administrator, and the developer.InetSoft solutions have been deployed at over 5,000 organizations worldwide, including 25% of Fortune 500 companies, spanning all types of industries.
How Does a Sales Operations Analyst Use Analytic Dashboards?
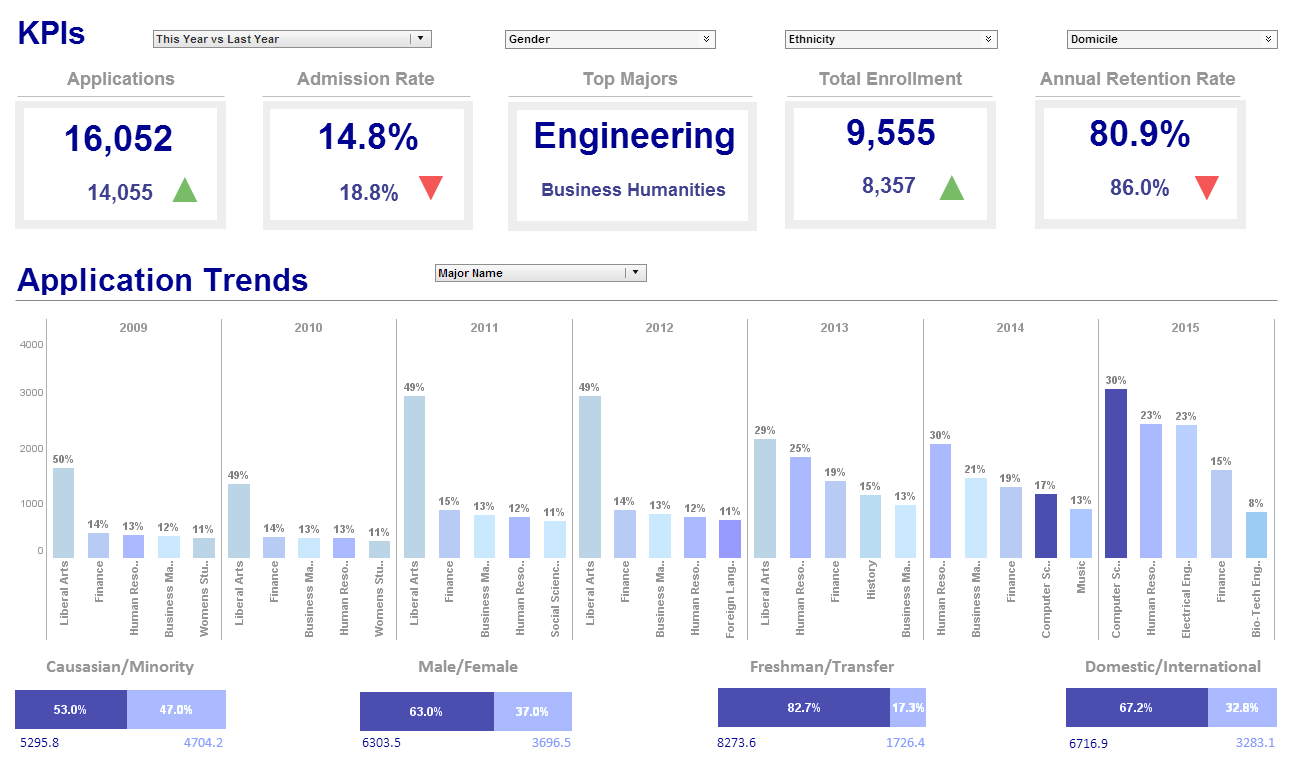
A sales operations analyst uses analytic dashboards to monitor, analyze, and optimize the performance of a company's sales operations. Analytic dashboards provide a real-time view of sales data and key performance indicators (KPIs), allowing sales operations analysts to quickly identify trends, patterns, and areas for improvement.
Here are some ways a sales operations analyst can use analytic dashboards:
- Monitor sales performance: A sales operations analyst can use analytic dashboards to monitor sales performance in real-time. They can track sales metrics such as revenue, pipeline, win rates, conversion rates, and customer acquisition costs to identify areas of strength and weakness.
- Identify trends and patterns: Analytic dashboards allow sales operations analysts to identify trends and patterns in sales data. They can use this information to develop insights into customer behavior, market trends, and competitor activities.
- Optimize sales processes: A sales operations analyst can use analytic dashboards to identify bottlenecks and inefficiencies in sales processes. They can use this information to optimize sales processes and increase sales productivity.
- Forecast sales: Analytic dashboards can help sales operations analysts forecast sales based on historical data and trends. They can use this information to develop accurate sales forecasts and make informed decisions about resource allocation and sales strategies.
- Track sales team performance: Sales operations analysts can use analytic dashboards to track sales team performance. They can monitor individual sales reps' performance, identify areas for improvement, and provide coaching and training to improve performance.
What Is the Difference Between a Sales Operations Analyst and an Operations Analyst?
A sales operations analyst and an operations analyst are two distinct roles that serve different functions within an organization.
A sales operations analyst is primarily responsible for analyzing and optimizing the sales operations of a company. They use data and analytics to identify trends, patterns, and areas for improvement in the sales process. They monitor key performance indicators (KPIs) such as revenue, pipeline, win rates, and customer acquisition costs to improve the effectiveness and efficiency of the sales team.
On the other hand, an operations analyst is responsible for analyzing and optimizing the operations of a company as a whole. They focus on improving the efficiency and effectiveness of various business processes across departments. They analyze data to identify bottlenecks, inefficiencies, and areas for improvement, and make recommendations for process optimization, cost reduction, and productivity improvements
While both roles involve analyzing data to identify areas for improvement and optimization, the key difference between a sales operations analyst and an operations analyst is their specific area of focus. A sales operations analyst focuses specifically on the sales function of a company, while an operations analyst takes a more holistic approach and looks at the overall operations of the company.
More Articles About Dashboard Analytics
Cloud-First Architecture for Dashboards - InetSoft's data intelligence is cloud-first. This not only means you can easily mash up cloud data sources. But it also ensures cloud deployment will seamlessly integrates with your in-cloud environemnt and user experience. As an option, InetSoft offers a pre-configured AWS instance with data intelligence tools to give you a supercharged data transformation and data mashup platform for interactive dashboarding, visual analytics, and production reporting...
Cloud-Flexible Analytic Dashboard Software - Since 1996 InetSoft has been delivering easy, agile, and robust analytic dashboard software that makes it possible for organizations and solution providers of all sizes. Our sophisticated applications include visually-compelling and interactive dashboards that ensure greater end-user adoption plus pixel-perfect report generation, scheduling, and bursting...
Evaluate InetSoft's Big Data Dashboard Tool - Looking for good big data dashboard tools? InetSoft's pioneering dashboard reporting application makes producing great-looking web-based reports and dashboards easy with a drag-and-drop designer and the ability to connect to all types of big data sources. View a demo and try interactive examples. A key InetSoft mission is to enable maximum end-user self-service. From the company's inception 15 years ago, InetSoft has sought to empower businesses and their staff with unfettered access to BI technology...
Provider of Dashboard Analytics -Are you looking for a good dashboard analytics provider? Since 1996 InetSoft has been making BI software that is easy to deploy and easy to use. Build self-service oriented dashboards and visual analyses quickly. InetSoft's data mashup engine solves the data access and transformation challenges that other tools cannot. Get cloud-flexibility to run your dashboard analytics wherever you want. No dedicated BI developer required. View a 2-minute demo and read customer reviews...