Building a Global Network Performance Dashboard
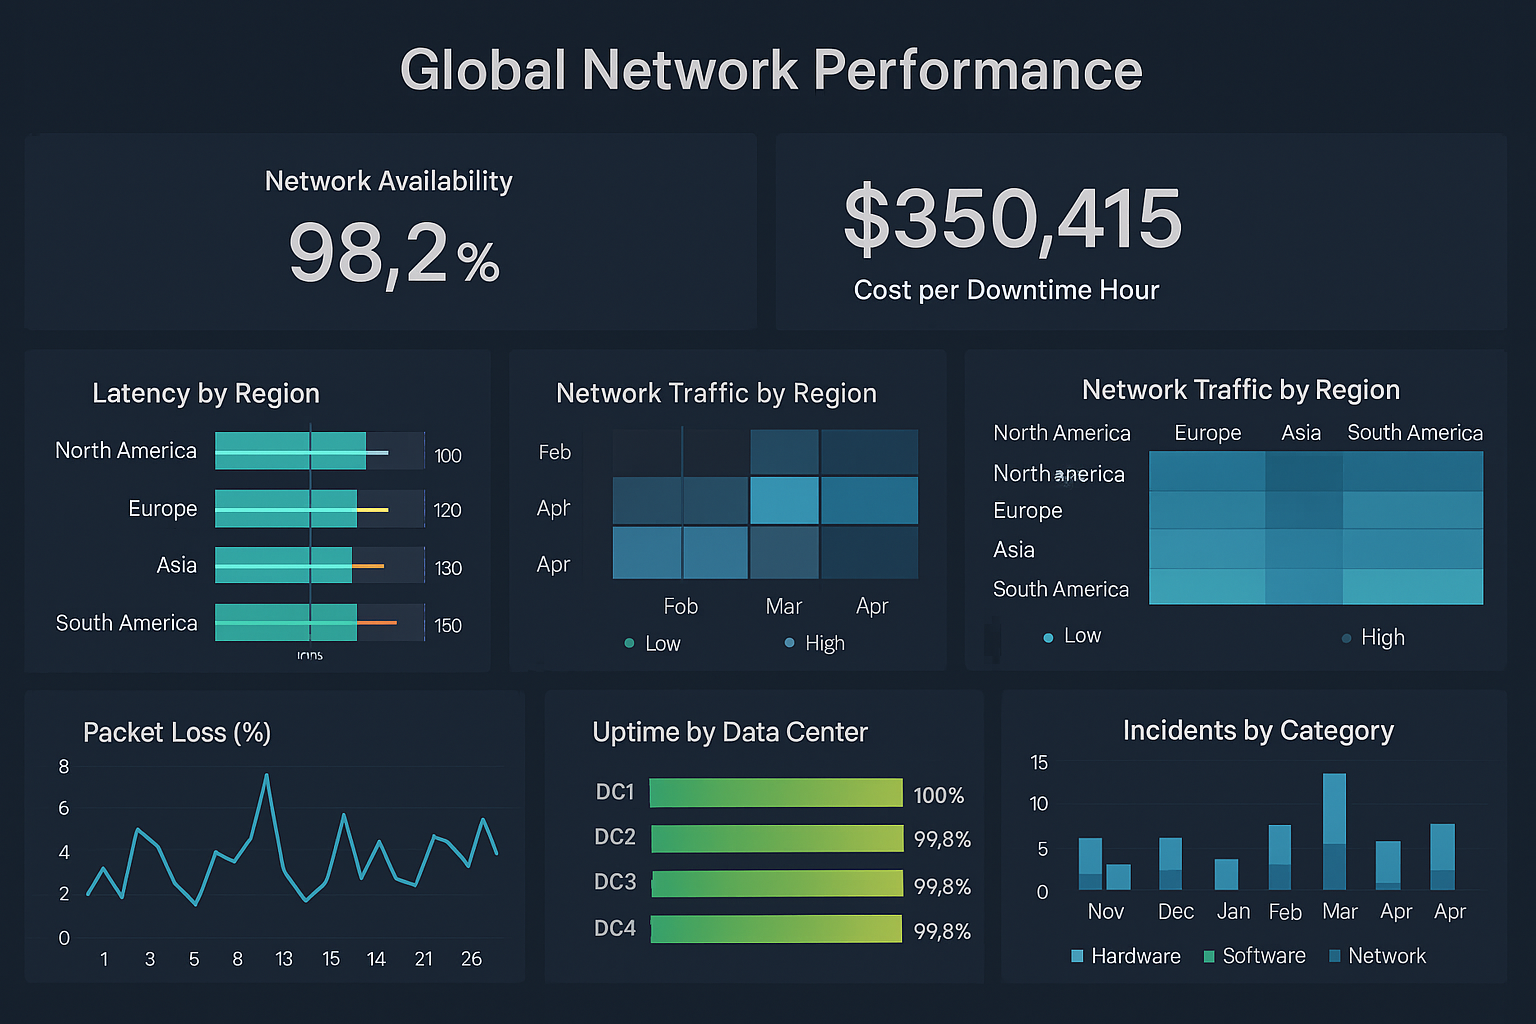
A dashboard for monitoring an enterprise's global network performance must access many data sources. And InetSoft, a premium BI software vendor, offers an application that handles big data with ease. Some of the features of the InetSoft flagship product, StyleBI, were made to deal with problems specific to wrangling overly-large, often diverse and disparate, data sources.
The emphasis of ease comes from a drag and drop interface that takes the more IT intensive parts of building a performance dashboard and pushes them into the background. This is a great advantage over other BI visualization software providers, because StyleBI lets the project designer experiment with data relations and aesthetic without wasting tightly budgeted time.
Global network performance dashboards are trying to answer a unique set of questions. Such as: How do you reconcile different time zones, languages, and established standards? Where is your web traffic piling up? What topics are trending? How are you performing inside those topics?
InetSoft believes that the web based building environment provided by StyleBI is the perfect malleable space to start building your answers.
InetSoft's Big Data Capability
With StyleBI you are not just building a dashboard, you are building a relationship with your data. Unlock your enterprise's potential by focusing in on your strategic KPI's, getting alerts and interacting with your data in real time. And with native apps and mobile compatibility Style Intelligence renders even your most complex dashboards pants-pocket portable.
Some of StyleBI's intuitive yet powerful features include:
- Automatic load balancing and failover on built-in Spark clusters
- Alerts for exceptions or business-rule triggers
- Analytic and monitoring oriented dashboards
- Visualization view re-use and collaboration
- Wide range of sophisticated chart types including custom geographic mapping, heatmap, waterfall, sunburst, treema, gantt, and pareto
- Drag and drop design using only a Web browser
- End user data mashup on the Web
- High performance scalability for large data sets and large volumes of users via InetSoft's Data Grid Cache technology
- Interactive reports and in-report exploration brushing for data exploration
- Production reports with embedded business logic and parameterization
- Unlimited multi-dimensional charting
Why an Industrial Gas Supplier Switched from Grafana to InetSoft's Serverless Dashboard Microservice
The industrial gas industry is not often in the spotlight, but it operates with a scale and complexity that rivals some of the largest global infrastructures. Companies in this space must manage sprawling networks of production plants, storage facilities, pipelines, and distribution hubs that span continents. Network operations centers (NOCs) play a critical role in ensuring that oxygen, nitrogen, and other gases are delivered safely, on time, and with high reliability. To keep this machinery running smoothly, analytics platforms that deliver real-time monitoring and actionable insights are indispensable. Recently, one such global supplier decided to replace its Grafana-based monitoring setup with InetSoft’s serverless dashboard microservice, a decision that proved transformative across licensing costs, IT resource utilization, overhead reduction, support structures, and ultimately end-user satisfaction.
The Limitations of Grafana in a Global NOC
Grafana had long been a favored tool for the company’s NOC team, thanks to its strong visualization capabilities and open-source roots. However, as operations scaled and demands for richer analytics grew, limitations became increasingly apparent. Grafana’s plugin ecosystem required constant vetting, customization, and maintenance. Licensing costs escalated once the organization outgrew the open-source edition and shifted to the enterprise tier to gain advanced authentication and support features. Moreover, IT resources were stretched thin by the need to manage servers, tune performance, and ensure high availability for global teams spread across multiple time zones.
Another challenge came in the form of dashboard sprawl and inconsistent user experience. Grafana made it easy for engineers to spin up dashboards, but governance and performance consistency suffered. When management wanted a consolidated view of plant uptime, distribution logistics, and incident reports, IT often had to build new visualizations from scratch or stitch together disparate panels. The result was a growing overhead in support requests and slower delivery of insights to decision-makers.
The Serverless Dashboard Microservice Advantage
InetSoft’s serverless dashboard microservice offered a fundamentally different approach. Instead of requiring teams to run and maintain a dedicated dashboarding infrastructure, the solution was designed as a microservice that could be deployed natively within the supplier’s cloud environment. This architecture eliminated the need for maintaining dedicated Grafana servers, patching them, and monitoring their uptime. Instead, the microservice scaled elastically with demand, a critical capability when plant activity or logistics monitoring spiked due to emergencies or seasonal demand surges.
Licensing presented another area of improvement. The Grafana enterprise licensing model was tied to users and features, creating rising costs as the industrial gas supplier expanded its workforce and required more advanced integrations. InetSoft’s model, in contrast, aligned with the serverless ethos: lightweight, consumption-based pricing that mapped directly to actual usage. This shift meant that the company no longer had to pay steep upfront fees for features that many users rarely touched. Instead, operational expenditures were predictable and directly tied to the real business value generated.
Resource and Overhead Savings
Resource utilization was one of the most dramatic areas of improvement. Grafana demanded a dedicated IT team to manage deployments, updates, and performance tuning. The serverless microservice freed those same staff members from infrastructure firefighting, enabling them to focus on higher-value activities such as integrating additional data sources from SCADA systems, IoT-enabled gas cylinders, and predictive maintenance applications. This shift not only reduced operational costs but also accelerated innovation across the IT department.
Overhead reduction extended into governance and support. InetSoft’s microservice allowed administrators to establish centralized governance over dashboards without impeding self-service for engineers and analysts. Row-level security, role-based access controls, and lineage tracking were all integrated into the microservice, ensuring that sensitive data about production yields and shipment schedules was only available to the right people. This level of built-in governance reduced the constant support tickets that had plagued the Grafana environment whenever permissions or compliance requirements shifted.
Support costs also fell substantially. With Grafana enterprise, the company was locked into a vendor support model that provided coverage but required navigating tiers of contracts and response-time agreements. InetSoft’s microservice simplified the equation by embedding support capabilities directly into its deployment ecosystem, enabling faster turnaround for troubleshooting and a more predictable cost structure. The reduction in vendor management overhead was a welcome relief for IT leadership.
Management and End-User Satisfaction
From the perspective of management and end-users, the shift was even more profound. Previously, executives often complained that dashboards in Grafana were too technical, cluttered with engineering-level details that were not relevant for strategic decision-making. InetSoft’s serverless microservice enabled dashboards that could be tailored to audiences, providing executives with clean, high-level KPIs while giving engineers the ability to drill down into operational data without cluttering the management layer. This separation of concerns improved satisfaction across the board.
End-users also benefited from improved responsiveness and reliability. With serverless scaling, latency dropped even during periods of peak demand, such as unplanned shutdowns or logistics rerouting events. The dashboards delivered by InetSoft were consistent, intuitive, and visually aligned with corporate standards, reducing training overhead. Instead of learning how to interpret a patchwork of Grafana dashboards, users interacted with a unified interface that guided them toward actionable insights.
Management particularly appreciated the ability to schedule reports and simulations. For example, weekly reports on plant uptime and distribution efficiency could be automatically generated and distributed across regional offices, saving managers the time previously spent chasing down updated visualizations. The built-in what-if simulation capabilities also allowed executives to explore scenarios, such as the impact of increasing production at a given facility or rerouting logistics in response to a disruption, directly within their dashboards. These features made decision-making more data-driven and timely, enhancing trust in IT as a partner in strategy rather than just a support function.
Long-Term Strategic Benefits
The move from Grafana to InetSoft was not simply a tactical change in tools—it represented a strategic evolution in how the industrial gas supplier approached analytics and operations monitoring. By removing the infrastructure burdens of Grafana and replacing them with a serverless, elastic microservice, the company aligned its analytics capabilities with its global scale and operational complexity. IT resources were freed to focus on innovation, governance was simplified, and licensing costs were more predictable and directly tied to value.
For a company operating in a sector where uptime, safety, and delivery reliability are paramount, the benefits of this transition extended far beyond IT. Management could make decisions with greater confidence, employees at all levels had better access to the data they needed, and the entire organization operated with greater efficiency and agility. Ultimately, InetSoft’s serverless dashboard microservice proved to be more than a replacement for Grafana—it became a foundation for the next era of digital transformation in industrial gas operations.


