Harvest Dashboard Software
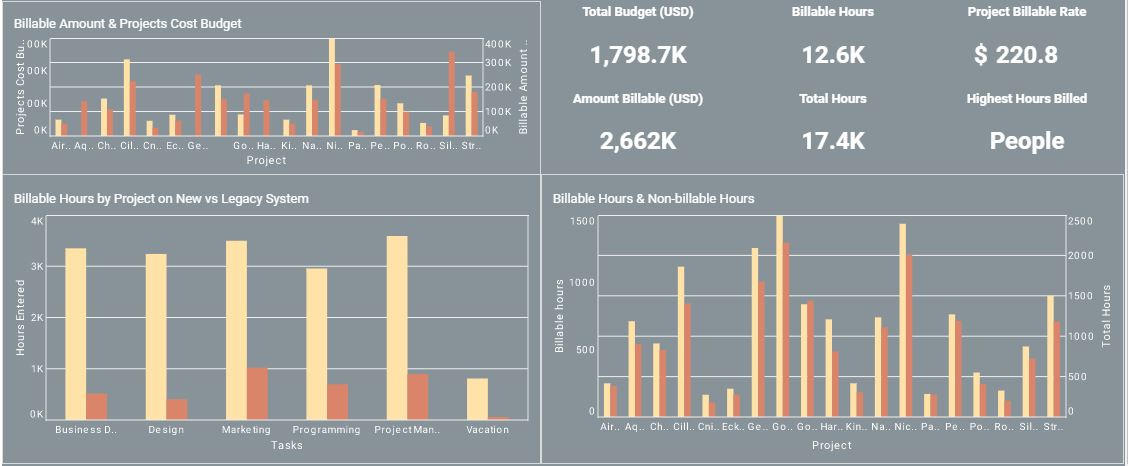
Managers foremost need project progress and coordination information such as dashboards displaying time tracking. However, the dashboards must be able to go beyond core project management data to give a holistic view of all factors that can impact on-time, on-budget delivery.
Harvest is a web-based time tracking tool developed and launched by Iridesco LLC in 2006. InetSoft's Style Intelligence comes with a custom Harvest data connector for incorporating time tracking data.

Self-Service Harvest Dashboards
Set up all of your Harvest reports to run automatically, without sacrificing flexibility and control
Visualization dashboards are the most intuitive way to understand project information. However, not all dashboards are created equal. InetSoft's web app can easily connect to Asana data to create self-service dashboards with rich built-in interactivity and customization.
For successfully delivery of projects, project managers must utilize all project related data, for example, supply chain and issue tracking system data. These systems are normally scattered. Some third party data may even be in Excel files. InetSoft's data mashup makes data processing a light-weight, business user self-serviceable process with great efficiency.
Online and Offline Reports
Make your reports accessible in the office, at home, or in the field.
Managers interact, share and collaborate with many parties. Visualization dashboards works excellently in most cases. Offline distributable reports become essential for many occasions where parties must share a large amount of information. InetSoft's pixel perfect, paginated document report engine is specifically desigend for these cases.
Data Mashup and Drilldown - Flexible Automated Reporting
Give your user's the power to discover new insights into your company's data
With StyleBI, you won't have to run redundant reports because of limited data access. InetSoft's solution can mashup data from many diverse sources in real time, giving you maximum flexibility in report generation.
Reports can also be made interactive with drilldown capability, enabling managers to find further insights in the data. Certain patterns or thresholds in the data can be set to trigger automated alerts, ensuring that certain conditions do not escape the reader's attention.

An Olive Pit Biofuel maker using StyleBI
An olive pit biofuel maker operates in a unique space where agricultural byproducts become the foundation for renewable energy production. To manage the complexity of coordinating with olive growers, processors, and distributors, the company integrates StyleBI into its workflow. By connecting StyleBI to Harvest Software and other applications, the company gains real-time visibility into raw material availability, processing throughput, and customer demand. Dashboards provide a unified view of these interconnected processes, ensuring production schedules are aligned with seasonal harvest cycles and fluctuating supply levels.
One of the key benefits of using StyleBI is the ability to track and analyze operational efficiency. By visualizing data from machinery monitoring systems, logistics software, and Harvest Software, managers can identify where bottlenecks occur, whether in drying pits, pelletizing lines, or transport to distribution hubs. Dashboards show downtime trends, maintenance needs, and energy consumption, giving decision-makers the insights needed to reduce waste and improve overall throughput. This level of transparency allows teams to optimize workflows and maintain a consistent supply of high-quality biofuel pellets.
Beyond operations, StyleBI plays a critical role in managing the financial and sustainability aspects of the business. By connecting to accounting applications, sales platforms, and sustainability tracking tools, dashboards can highlight profitability by product line, forecast future sales, and monitor carbon offset metrics. This empowers executives to see not just how much biofuel is being produced, but also how the enterprise contributes to sustainability goals. Being able to present both financial and environmental performance metrics on demand strengthens credibility with investors and stakeholders who prioritize green initiatives.
Finally, StyleBI enhances collaboration across teams by offering role-specific dashboards tailored to the needs of operations staff, sales teams, and executives. Harvest managers can track incoming supply and processing schedules, while the finance team can monitor margins and cash flow, and the executive team can view high-level KPIs across sustainability, production, and revenue. By bridging different systems and offering a centralized view of performance, StyleBI transforms the olive pit biofuel maker into a data-driven organization capable of scaling its impact in the renewable energy sector. The result is a business that runs more smoothly, adapts faster to change, and can make decisions grounded in actionable insights.