Marketing Client Dashboard Software
In the field of marketing consulting, handling data properly is imperative because it enables businesses to understand market dynamics, optimize marketing strategies, enhance customer relationships, and ultimately drive sales growth. Accurate data analysis allows companies to monitor and evaluate the performance of marketing campaigns, leading to more precise customer segmentation and more efficient allocation of resources.
Therefore, finding a tool that enables robust data analytics and BI dashboard tools is highly valuable for marketing. Such a solution can help businesses distill useful information from large datasets to support decision-making and improve overall marketing effectiveness.


Marketing Client Management Dashboard
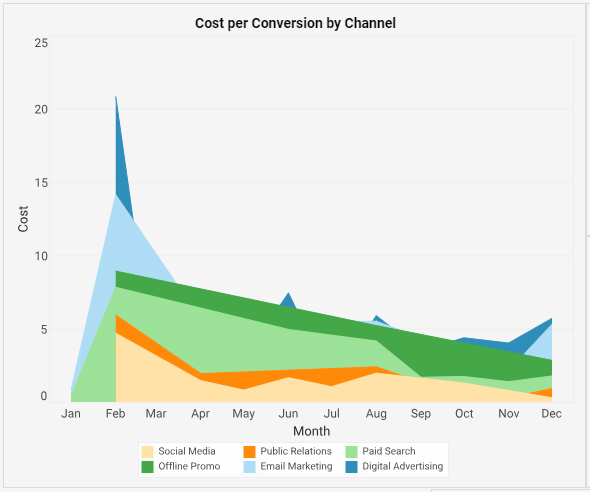
Using the above dashboard as an example, you can more intuitively understand and feel the help InetSoft can provide in this area. Take this multidimensional fill chart, which shows the cost of converting leads through different marketing channels over the course of a year.
The various colors represent different marketing channels to help viewers quickly assess which channels are becoming more cost-effective over time.
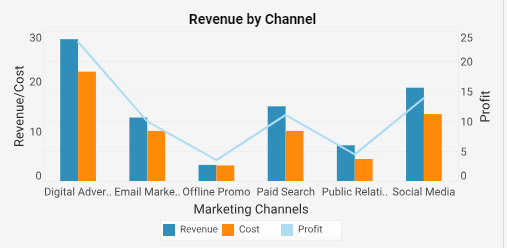
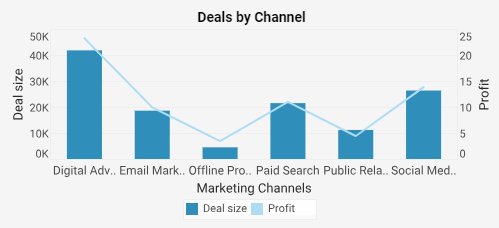
This combination chart (bar and line) depicts the deal size and profit generated from each marketing channel. The bar graph shows the size of the deals, while the line graph indicates the profit. This dual representation helps compare the volume of deals to the profit they bring in, potentially highlighting the most lucrative channels.
In addition, viewers can also filter through more information they want to get. The filter of marketing channels lists the different marketing channels, and it can provide a quick view of the specific channels that the audience wants to know about.
Month and Deal Size sliders allow users to filter the data displayed on the dashboard for a specific time period, which can be useful for analyzing seasonal trends or the impact of specific campaigns.

InetSoft's web-based platform offers designers and business users a collaborative environment for creating visual dashboards that are fully controllable across devices, bridging the gap between business needs and technical execution. With an integrated user portal, the platform facilitates a seamless design process, enhancing the usability for non-technical users. InetSoft helps to analyze and visualize market trends and campaign effectiveness, focusing on growth indicators such as market share and cost efficiency, thereby enabling the transformation of data into actionable business insights.
From Monday.com to StyleBI: How a Marketing Agency Leveled Up Its Client Dashboards
A mid-sized, performance-driven marketing agency outgrew its project-centric reporting stack and migrated from Monday.com to StyleBI for Marketing Client Dashboards. The change wasn’t about project management—Monday.com still handled tasks just fine. The pivot was about analytics depth, data modeling, and the ability to serve real-time, self-service dashboards to demanding clients without bouncing between spreadsheets, exports, and stitched-together visuals. Below is how the switch unfolded, what changed in day-to-day operations, and why it materially improved client retention and margins.
The Problem With “Project-First” Reporting
- Fragmented KPIs: Performance metrics lived in Google Ads, Meta, LinkedIn, TikTok, HubSpot, GA4, Shopify, and CRMs. Monday.com could display status and some numbers, but not unify them into a governed, drillable analytics layer.
- Export Hell: Weekly exports into spreadsheets turned into “reporting theater.” Analysts spent 6–10 hours per client per month wrangling CSVs and screenshots.
- Shallow Visuals: Stakeholders needed cohort analyses, attribution comparisons, and pacing forecasts—features that demanded semantic modeling, not just widgets.
- Client Transparency: Clients wanted 24/7 access with role-based views (CMO, channel manager, e-commerce lead) rather than one-size-fits-all dashboards.
Why StyleBI
StyleBI is purpose-built for analytics. It lets the team model metrics once and reuse them everywhere, connect to many sources without brittle pipelines, and publish governed dashboards that clients can explore safely. The agency didn’t abandon Monday.com for task orchestration; it just stopped trying to force an analytics job into a project board tool.
Target Outcomes
- Cut monthly reporting labor per client by 50–70%.
- Provide live, self-service dashboards with drill-down, filter books, and segmented views.
- Standardize definitions: what counts as a “Marketing Qualified Lead,” a “Net New Customer,” or “ROAS (7-day click)”.
- Enable multi-touch attribution views (last click, position-based, data-driven proxies) side-by-side.
- Automate pacing and forecast alerts (budget burn rate, CPA/ROAS thresholds).
Data Architecture After the Switch
- Connectors: Direct connectors to Google Ads, Meta, LinkedIn, TikTok, GA4, HubSpot, Salesforce, Shopify, and BigQuery/Snowflake for warehoused data.
- Semantic Layer: StyleBI models define core metrics—Impressions, Clicks, CPC, CPM, CTR, Spend, Conversions, Revenue, CPA, ROAS—and calculation rules (e.g., currency normalization, attribution windows, channel mapping).
- Data Marts: Separate, lightweight marts for Acquisition, Engagement, and Revenue. Each mart exposes a curated set of dimensions (Channel, Campaign, Ad Group, Creative ID, Audience, Country, Device, Landing Page).
- Row-Level Security: Client-specific policies so external users only see their own data; internal views aggregate across accounts for executives.
Flagship Dashboard Views
The agency rolled out a library of dashboards, each designed for a specific audience and decision cadence:
- Executive Snapshot (Daily): Cross-channel ROAS, blended CAC, revenue pacing vs. target, top movers, and budget heatmap by week.
- Channel Deep Dives (Weekly): Google Ads, Meta, LinkedIn—creative performance by hook/headline, audience overlap, frequency fatigue, and learning-phase markers.
- Attribution Explorer (Bi-Weekly): Compare last click, first click, position-based, and GA4 data-driven proxies; waterfall of assisted conversions; scenario toggles for allocation.
- E-commerce Lens (Daily): AOV trends, product/collection performance, cart abandonment, LTV by cohort, and promo code impact analysis.
- Leads & Pipeline (Weekly): MQL→SQL→Closed Won funnel, by source and campaign; SLA conformance; revenue influence and pipeline velocity.
Key Features the Team Leaned On
- Reusable Metrics: Define ROAS once; use everywhere. No more “why is ROAS different on slide 3?” arguments.
- Filter Books & Bookmarks: Save client- or persona-specific filter presets (e.g., “Brand Campaigns Only” or “NA + EMEA, Q3”).
- Write-Back Notes: Analysts annotate anomalies (e.g., iOS privacy changes, pixel outage) so context travels with the chart.
- Alerting: Budget burn, CPA/rate of change, conversion drop, and tracking gaps trigger emails and Slack posts.
- Embedded Portals: Branded client portal with SSO, custom logo, and per-role navigation.
Migrating Off Monday.com Reports: A Pragmatic Plan
- Inventory & Rationalize: Catalogue every dashboard, slide deck, and spreadsheet. Tag as keep, merge, or retire. Kill 20–30% of “nice-to-have” views on day one.
- Define the Canon: Publish a simple glossary: revenue, net revenue, gross margin, CAC, ROAS, LTV, and attribution windows. Opinions beat ambiguity.
- Source Connections: Stand up connections to ad platforms, analytics, and CRM. Normalize currencies and time zones; lock calendars to client fiscal periods.
- Model Core Marts: Build the Acquisition, Engagement, and Revenue marts. Validate against historical exports to establish trust.
- Pilot One Client: Pick a friendly yet demanding client. Recreate their QBR entirely in StyleBI, then add two “wow” analyses you couldn’t do before.
- Train & Embed: Run a 60-minute internal workshop, then a 30-minute client onboarding. Provide “how to use this dashboard” tooltips inside the product.
- Decommission: Freeze Monday.com-based reporting and redirect links to StyleBI dashboards. Archive old snapshots for audit.
Before vs. After: Day-to-Day Reality
| Area | Before (Monday.com Reports) | After (StyleBI) |
|---|---|---|
| Metric Definitions | Inconsistent across clients and decks | Centralized semantic layer with versioning |
| Refresh Cadence | Weekly manual exports | Automated, near-real-time pulls |
| Client Access | Static PDFs and screenshots | Interactive, role-based portal |
| Analysis Depth | Topline, limited drill-down | Drill to creative, audience, device, and cohort |
| Alerting | Ad hoc Slack pings | Threshold and anomaly alerts with context |
| Time Spent | 6–10 hours per client per month | 2–4 hours, focused on insight not assembly |
Governance & Trust
- Versioned Metrics: When the definition of “Qualified Lead” changed, the team versioned it (QL_v2) and backfilled a note so historical charts made sense.
- Acl & RLS: Role-based access ensured the client CFO saw blended CAC and margin, while channel managers saw creative and audience breakouts.
- Data Lineage: Every number traces back to a platform field and transform step. That ended half the audit meetings.
Impact on Client Relationships
- Faster QBRs: Meetings shifted from “what happened” to “what will we try next?” because the dashboard answered baseline questions instantly.
- Confidence to Test: With quick reads on lift and guardrail metrics, the team launched more creative experiments without fear of getting lost in reporting cleanup.
- Renewals & Upsells: The clarity of pacing and forecast views made budget conversations easier. Several clients expanded spend after two months.
Common Pitfalls (And How They Avoided Them)
- Metric Drift: Solve with a published glossary and a single owner who approves changes.
- Over-Dashboarding: Limit to a small set of canonical views; add drill paths instead of more pages.
- Connector Spaghetti: Centralize platform connections and reuse in multiple dashboards; don’t duplicate.
- Training Debt: Embed short, in-place help text and a 2-minute “getting started” video linked from the dashboard.
Example KPI Blocks They Standardized
- Acquisition: Spend, Impressions, Clicks, CTR, CPC, CPM, New Users, Sessions, Bounce Rate.
- Conversion: Adds to Cart, Checkout Initiations, Purchases, Conversion Rate, CPA, ROAS (7/14/28-day windows).
- Revenue Quality: AOV, Refund Rate, Net Revenue, Contribution Margin, LTV (90/180/365-day cohorts).
- Engagement: Video Views (3s/ThruPlay), Frequency, Reach Overlap, Creative Fatigue Index.