Music Analytics Dashboard
Nowadays, streaming media has been one of the most complex business scenarios. Data management ability and trend analysis are of great significance for audio streaming platforms and content creators.
InetSoft's business intelligence tool makes a solution of high applicability and flexibility possible to drive business breakthroughs.


InetSoft's cloud-flexible business intelligence solution allows the streaming platform to choose the most suitable data storage platform with high performance. Our data mashup technology provides end users with the foremost tool to implement ETL processes on batch-updated audio feature data, user interaction data, and streaming data from multiple data sources.
Furthermore, InetSoft's BI platform is well-designed for both technical and non-technical end users. All processes of data management, including security control and database schema design, can be easily done with a point-and-click interface.
In audio streaming services, huge data volume can be another challenge for analysts to stay up-to-date with the latest trends of user preferences. InetSoft utilizes caching and data blocks to increase the update efficiency of interactive analytic dashboards to achieve refined operations. Moreover, the OEM feature offers multi-tenant hosting to simplify processes and reduce costs. In streaming media products, user reactions become more unpredictable, thus accentuating the need for monitoring more features and key performance indicators. InetSoft's custom dashboard offers a variety of multiple charts and filter components to visualize multiple features such as the popularity of songs, trends of audio features, and user engagement.
InetSoft's Audio Analytics Dashboard
For prominent audio streaming media platforms, song recommendation is a priority in refined operation. A real-time dashboard provides a vantage point to dig into user preferences on multiple features and identify the fusion of music elements among different genres. Targeted marketing strategies can be performed based on related insights. In a UGC (User Generated Content) product, whether the platform can provide useful creator tools is closely associated with creator performance and churn rate. A flexible dashboard by InetSoft can be easily embedded into applications to help creators find the next hot music genre in certain areas such as short videos. InetSoft's data intelligence web app is compatible with advanced machine learning models to mine hidden insights. It allows end users to have predicted information for reference to make data-driven decisions.
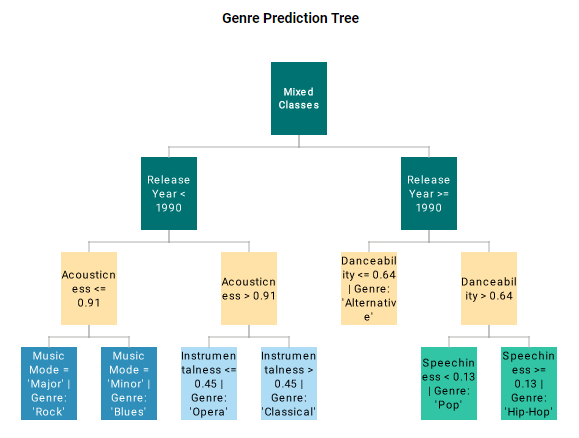
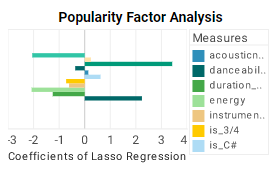
In the example dashboard, the most important audio features impacting popularity are identified by a regression model. Moreover, end users can deep dive into the music fusion by checking the simulated decision tree of genre classification.

In the music streaming industry, content operation of platform products is always a key part of marketing. Basically, membership and advertisement are two ways of monetization for most streaming media platforms, which require more engagement from users. Therefore, to better stimulate user enthusiasm, a smart BI platform is essential for business analytics, marketing, and activity operation teams to track the latest trends of user preferences and take corresponding actions.
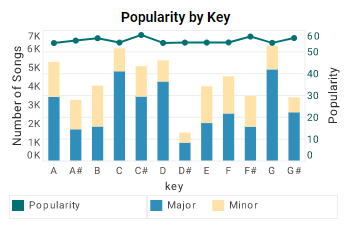
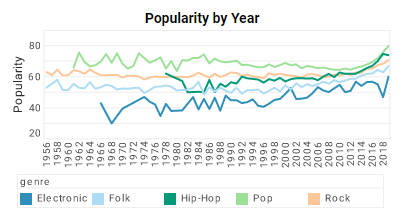
The first step for executives is to get an overview of Music Population. Activity operation specialists can refer to the dashboard chart of Top 6 Genres, Top Artists, and Popularity by Year to learn about music market share. By filtering the time frame and music type, merging music genres can be identified as the target of marketing and chosen for further analysis. The second step is to dismantle user preferences on genres or artists to get hidden insights. In music streaming platforms, new recommendation sections popping up rely on feature-level analysis, which sets a baseline for the engineering team to optimize. In the Example Dashboard, the music feature chart shows a clear comparison between certain audio features. Besides, music is clustered by its key and mode, and different user groups tend to have different preferences for those features. Multiple filters such as time signature, key, and mode are preset for dashboard users to deep dive into any feature they are interested in.
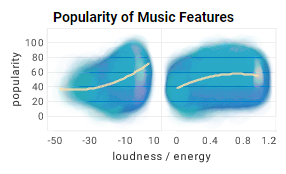
The third step is to get quantitative predictions by machine learning algorithms. The Popularity of Music Features Chart in the example dashboard shows several nonlinear relationships between certain audio features and popularity. The most influential factors of different genres can also be checked in the Popularity Factor Analysis and Genre Prediction Tree charts.

Other Business Intelligence Applications for Streaming Media
- Membership subscription and pricing
- User acquisition and retention
- Advertisement on music platforms
- A/B Test for platform components
- User review analysis
InetSoft Articles on Various Industry Analytics
- User-Friendly Interface
This page outlines InetSoft’s healthcare data intelligence approach for clinicians and administrators. It highlights tools for creating, monitoring, and adjusting KPIs that support patient outcomes and operational efficiency. The piece emphasizes ease-of-use for non-technical teams and rapid iteration of governed metrics.
- Zero Client Reporting
InetSoft explains how manufacturers can unify MES, ERP, and supplier feeds into analytics dashboards. It calls out ad hoc exploration, multi-dimensional analysis, and collaborative workflows suited to production floors and quality teams. Examples cover cycle time, defect rate analysis, and materials forecasting.
- Improve Sales Performance
A retail dashboard walkthrough shows how managers compare goals versus actuals by period and category. The article focuses on spotting sales patterns and the factors that drive profitability. It demonstrates how a single view supports store-level action and executive rollups.
- Data-Driven Approach Allows
This guide examines analytics in the travel and trekking sector, from demand forecasting to pricing optimization. It describes how transactional data fuels segmentation, quality assurance, and trend identification. Practical examples show improved service delivery and targeted offers.
- Reduce The Cost
A healthcare data science piece explores policy design and procedure optimization using analytics. It illustrates how evaluating care pathways can achieve similar outcomes with lower spend. The discussion ties model outputs to operational decisions for hospital leaders.
- Point-And-Click
Methods
This quality control dashboard example targets defects, pipeline duration, and shift performance. Readers see how built-in filters enable quick root-cause analysis without SQL. The page stresses real-time alerts and faster corrective actions on the production line.
- Direct Access To Almost
InetSoft’s banking and financial services page describes complete BI coverage from reporting to analytics. It emphasizes direct access to diverse data sources without heavy middleware. A live demo showcases risk, profitability, and customer portfolio dashboards.
- Improve Their Operations
This article discusses analytics for railroads, including fleet monitoring and safety improvements. It outlines how dashboards aid real-time decisions for freight operations. The content connects sensor data and performance metrics to maintenance and scheduling.
- Comprehensive Software Application
The education industry page presents dashboards for administrators and scholars alike. It highlights flexible pricing and ease of deployment for campus-wide analytics. Readers can explore a live demo to see enrollment, outcomes, and resource KPIs in action.
- Public Funds Are Being Wasted
Government analytics content focuses on transparency, program effectiveness, and KPI communication. It explains how agencies track spend and outcomes with secure, web-based dashboards. The page demonstrates role-based access for field agents, analysts, and public stakeholders.