Online Streaming Analytics
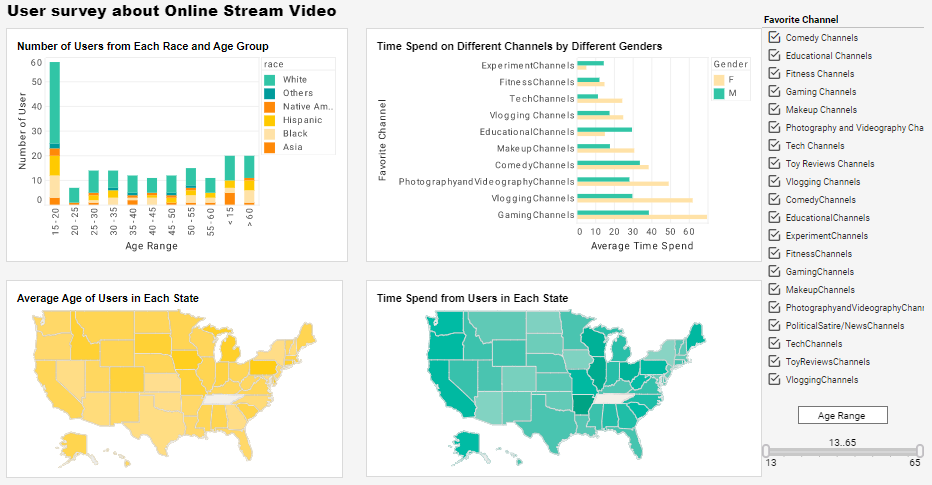
This online streaming analytics dashboard was created using InetSoft's StyleBI. It offers the managers at streaming companies not only an overall understanding of their user base, but also detailed analytics and comparisons of diverse channels, helping managers to triangulate target audience positioning and video content improvement, improving business value and ROI for companies that offer video streaming applications.
The content diversity of online video streaming covers the interests and tastes of diverse user groups from various regions, age ranges, and cultural backgrounds. Because of this, the complexity of the user base can make streaming platform managers unable to extract value from the large volumes of user data, not knowing where to begin in making an analysis.
 |
Read the top 10 reasons for selecting InetSoft as your BI partner. |
Online Streaming Dashboard
This dashboard, created with StyleBI offered by InetSoft can provide video streaming companies with integrating data from multiple channels, helping to present trends, highlight comparisons and focus on problems, so that managers can find an entry point to observe complex data situations.
When a large amount of real-time data is pouring into the database of stream video companies every day, the data modelling engine from Inetsoft enables companies to quickly massage their data so that it is ready to create data visualizations. Inetsoft's focus in their products is ease of implementation. This InetSoft dashboard can easily adapt to any and all devices, not just PCs, with managers checking the dashboard at any time from their mobile phones or tablets.
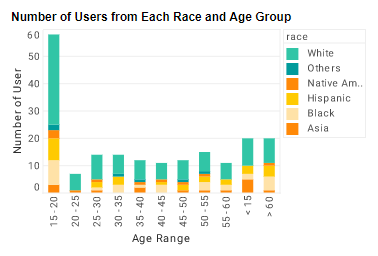
The stack bar chart covers as much information as possible, as managers can directly see the distribution of users in different age ranges, and the ethnic background of each age range. If in-depth analysis on a specific age range is needed, Inetsoft's filters can cater to different demands, with the range filtering on age range, and the selection list or tree for filtering channels.
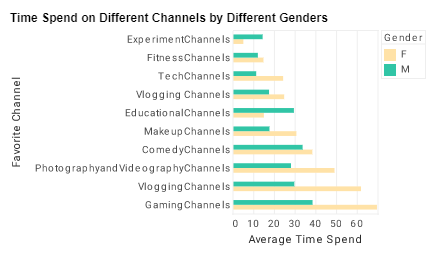
Conditions on charts and tables can help the managers to focus on the key points: The top 10 performing channels will be the ones managers care about. If they want to investigate the gap between a certain channel and the most popular one, they can use sort and filter functions ot investigate. For example, when comparing the popularity of the two channels among male and female audiences, those functions could be combined and used to investigate and develop a channel improvement plan.
 |
View the gallery of examples of dashboards and visualizations. |
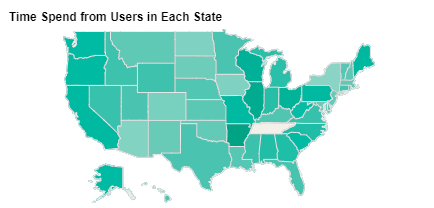
The location information of users is crucial for video streaming companies to figure out the cause of certain user trends. The geographic chart is convenient for analyzing user adoption. Managers can see the average age of users in different states, which can guide decisions regarding the delivery of different video content to different states in a targeted manner according to the taste of users of different age groups. At the same time, user time spent broken down by state can also help the managers determine whether these users are mature loyal audience segments or potential loyal audience segments who still need to be cultivated. The dashboard can provide guidance regarding whether to continue to satisfy the target audience or guide them towards greater adoption.
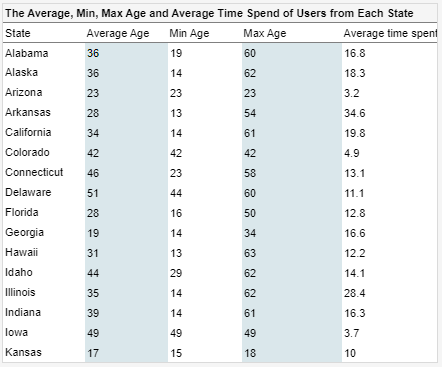
In addition to charts, Inetsoft also provides various table options for use in visualizations. Especially for the video streaming industry, a comprehensive user portrait is crucial. In this case, a freehand table containing multiple dimensions can effectively meet the requirement. The process of creating a freehand table is very easy and adoptable, allowing users to manually add dimensions based on the standard table; no need to build from zero. For this dashboard, the freehand table allows managers to know in detail the time spent by male and female viewers of different channels. Based on this knowledge, the managers could make decision regarding which genders group should be targeted by different channels. The detailed age information of users in each state is also valuable, as managers can see not only the average age of the users, but also the age range, which helps provide guidance on whether the video content available in this state should be diverse or targeted at different age groups.
 |
View a 2-minute demonstration of InetSoft's easy, agile, and robust BI software. |
