InetSoft's Free Performance Management Software
The success of an enterprise depends on many different elements. Too often, one of the most influential factors is overlooked; the managing of employee performance and productivity. Organizations that are looking to manage performance can take advantage of Visualize Free, provided by InetSoft.
InetSoft offers Visualize Free as a free cloud-based performance management application for business users. This data visualization tool has built-in interactivity feature to make analysis of performance management easy. It suits enterprises of any scale, being able to track the progress from an individual level to the whole company.
With InetSoft's Visualize Free, executives have the guidance and ability to steer their enterprise towards its full potential, without having to invest money in BI software.
Take a closer look at Visualize Free.


Optimize Overall Performance
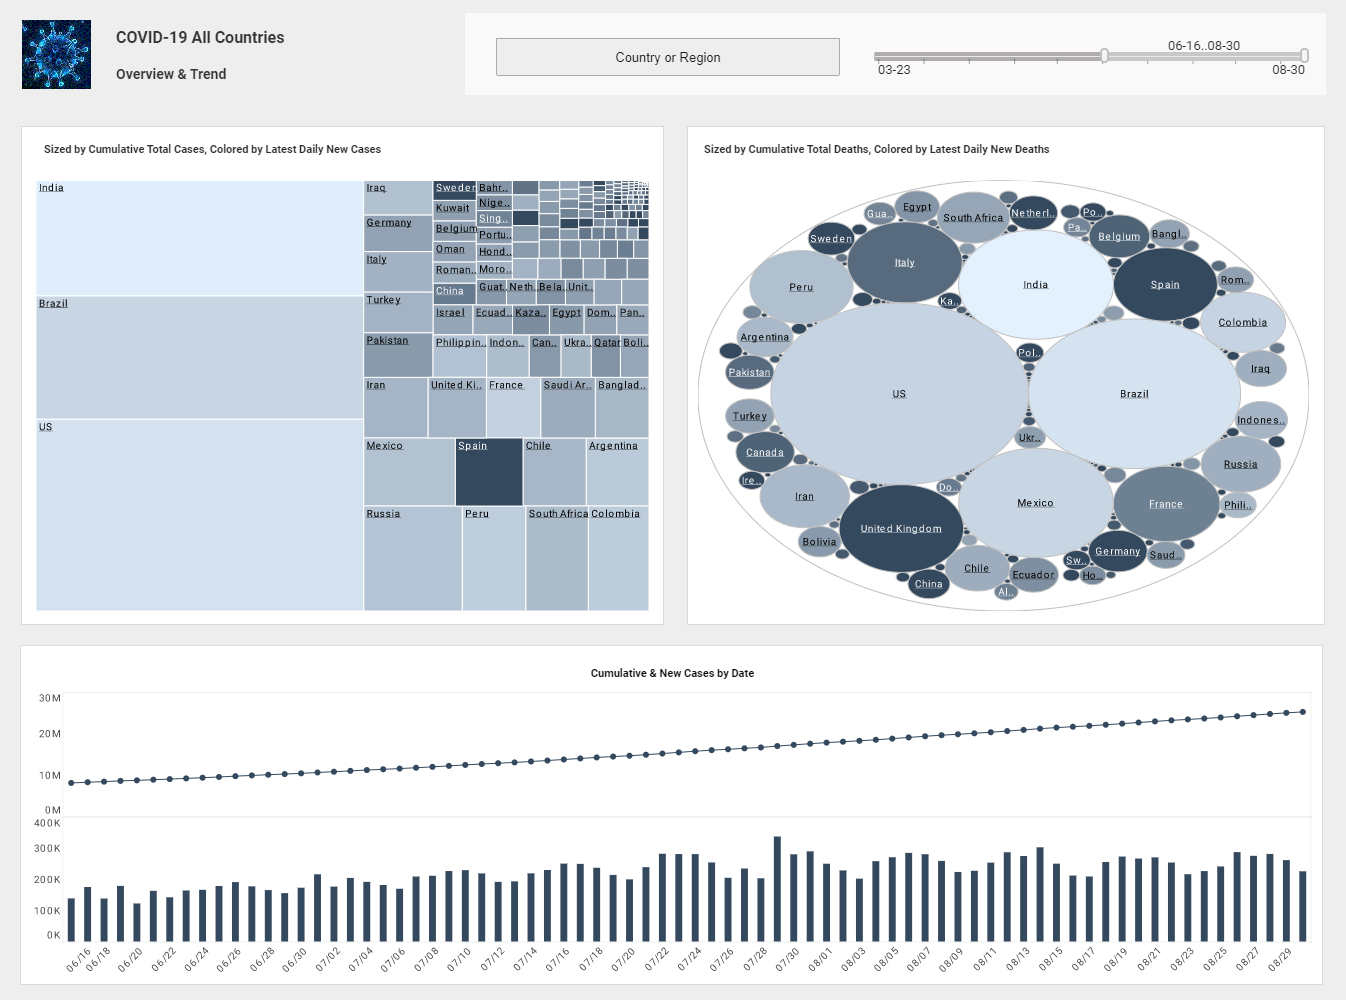
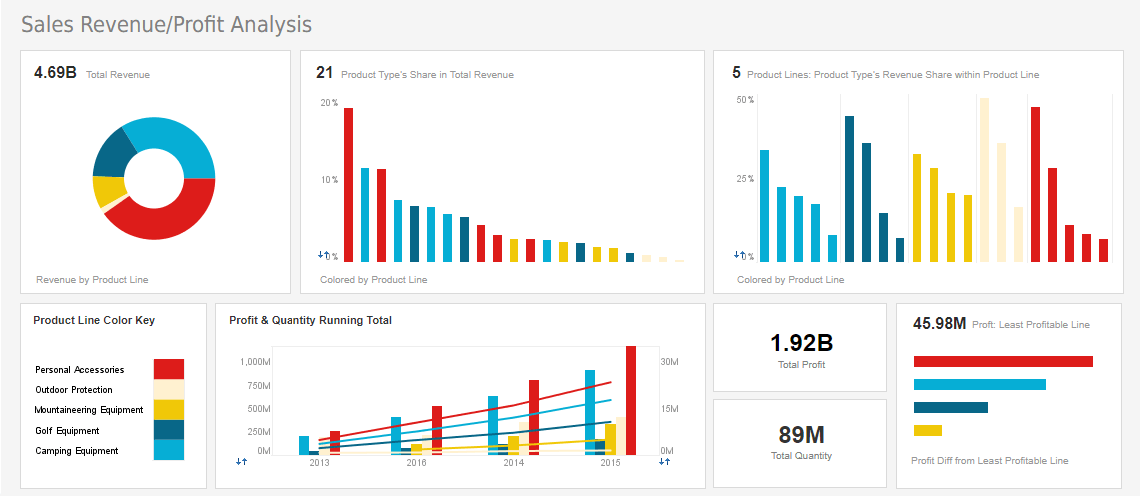
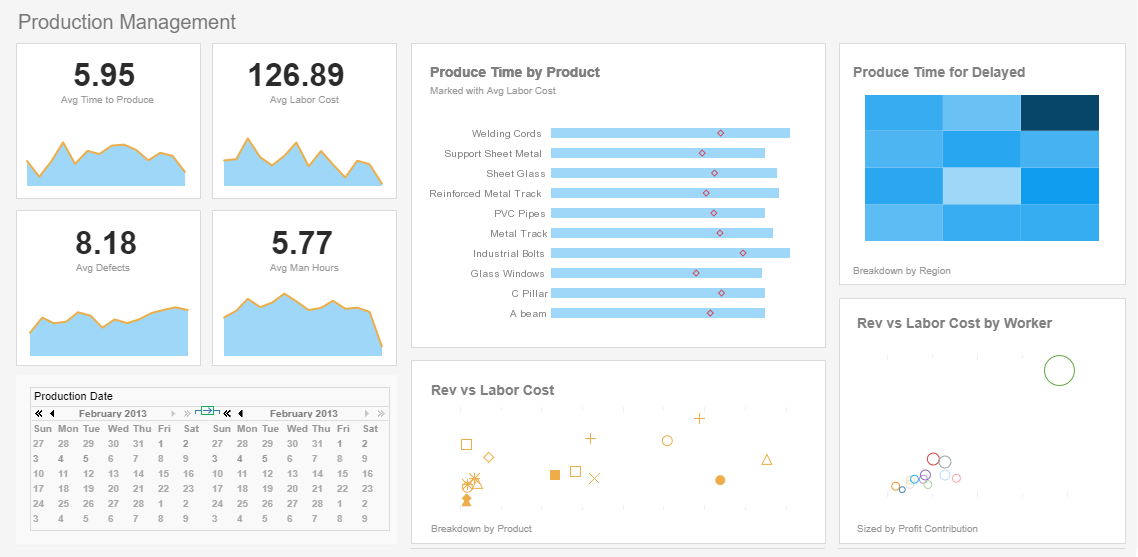
Dashboards are an effective visualization tool for monitoring business performance. Ranging from executive dashboards, to interactive visual analysis, to business management dashboards, Visualize Free's user-defined dashboards allows users to better analyze their data, making it easier to recognize the enterprise's organizational strengths and weaknesses.
Like other InetSoft products, Visualize Free is a zero-client server application that is hosted on a web platform. This enables dashboards to be accessed and modified from any web-browser and mobile device. The Java-based application can be installed on any OS, including Windows, Unix, and Mac.
Visualize Free equips its users with an impressive tool for creating detailed, interactive dashboards that are easy to build and modify. Only requiring Excel-level skills, the drag-and-drop interface can be navigated and utilized by employees at all levels of an organization.
Try Visualize Free for yourself, click here to start using it for free.
About InetSoft
InetSoft is a pioneer in delivering easy, agile, and robust business intelligence software that makes it possible for organizations and solution providers of all sizes to deploy or embed full-featured business intelligence solutions. Application highlights include visually-compelling and interactive dashboards that ensure greater end-user adoption plus pixel-perfect report generation, scheduling, and bursting.
InetSoft's patent pending Data Block technology enables productive reuse of queries and a unique capability for end-user defined data mashup. This capability combined with efficient information access enabled by InetSoft's visual analysis technologies allows maximum self-service that benefits the average business user, the IT administrator, and the developer.
InetSoft solutions have been deployed at over 5,000 organizations worldwide, including 25% of Fortune 500 companies, spanning all types of industries.
How a Girls Volleyball Team Uses Visualize Free for Performance Management
Performance management is not only for businesses and corporations—it has a meaningful role in sports as well. A girls volleyball team, competing in a regional league, discovered this firsthand when they adopted Visualize Free, a web-based analytics and visualization tool. Their coaching staff had long relied on hand-kept statistics, whiteboards, and sporadic video analysis to assess how players performed in matches. While this system provided some information, it lacked depth and made it difficult to connect player performance with long-term improvement goals. By introducing Visualize Free into their daily training and match preparation, the team transformed the way they managed performance and made decisions on the court.
One of the first areas where Visualize Free proved valuable was tracking in-game statistics. Volleyball is a sport that generates large volumes of data: serves attempted, serves won, digs, assists, blocks, and hitting percentages all contribute to the team’s overall performance. Previously, the assistant coach recorded these statistics manually and presented them in simple tables. With Visualize Free, the team could load the same raw stats into the platform and create interactive dashboards that revealed patterns more clearly. For example, a heatmap showing where opponents were most successful at landing spikes helped the team adjust defensive formations. Likewise, visualizing serving percentages over time showed which players were improving and which needed more focused drills.
Another major benefit of Visualize Free came in the area of individual player development. Each player on the roster had unique strengths and weaknesses. For example, one outside hitter had a high hitting percentage but also committed too many service errors. Another player excelled defensively but struggled with quick transitions to offense. By building dashboards dedicated to each athlete, the coaching staff could track metrics that mattered most for their position and role. This data-driven approach allowed for customized training plans: setters focused on increasing assist efficiency, while liberos monitored dig success rates and passing accuracy. Players appreciated being able to see their progress visually, which motivated them to work harder during practice.
Team strategy also improved with the use of the tool. Volleyball matches are often decided by momentum swings and the ability to exploit opponent weaknesses quickly. With Visualize Free, the coaching staff could prepare scouting reports in a more engaging, visual manner. Opponent tendencies—such as a middle blocker’s favorite attack angle or a team’s preferred serve rotation—were displayed in charts that were easier for players to understand than long written reports. This not only improved preparation but also built confidence among the players, who felt more equipped to step onto the court with a solid game plan supported by data.
Beyond competitive advantages, Visualize Free also enhanced communication within the team. Athletes could access the dashboards on their own devices, which opened up discussions between players and coaches about goals and progress. Team meetings became more collaborative, as players could bring up their stats and ask specific questions about how to improve. The transparency created a culture of accountability—everyone could see how they contributed to the team’s performance, which encouraged a collective effort to improve.
The adoption of Visualize Free also had unexpected benefits for parents and supporters. By creating simplified dashboards that highlighted key match statistics and seasonal progress, the coaching staff could share updates with families. This visibility helped parents understand not only the outcomes of matches but also the growth of the players. It fostered a deeper sense of community, as families could see the results of their daughters’ hard work represented in tangible, visual form.


