Real Time Dashboard Reporting Solution
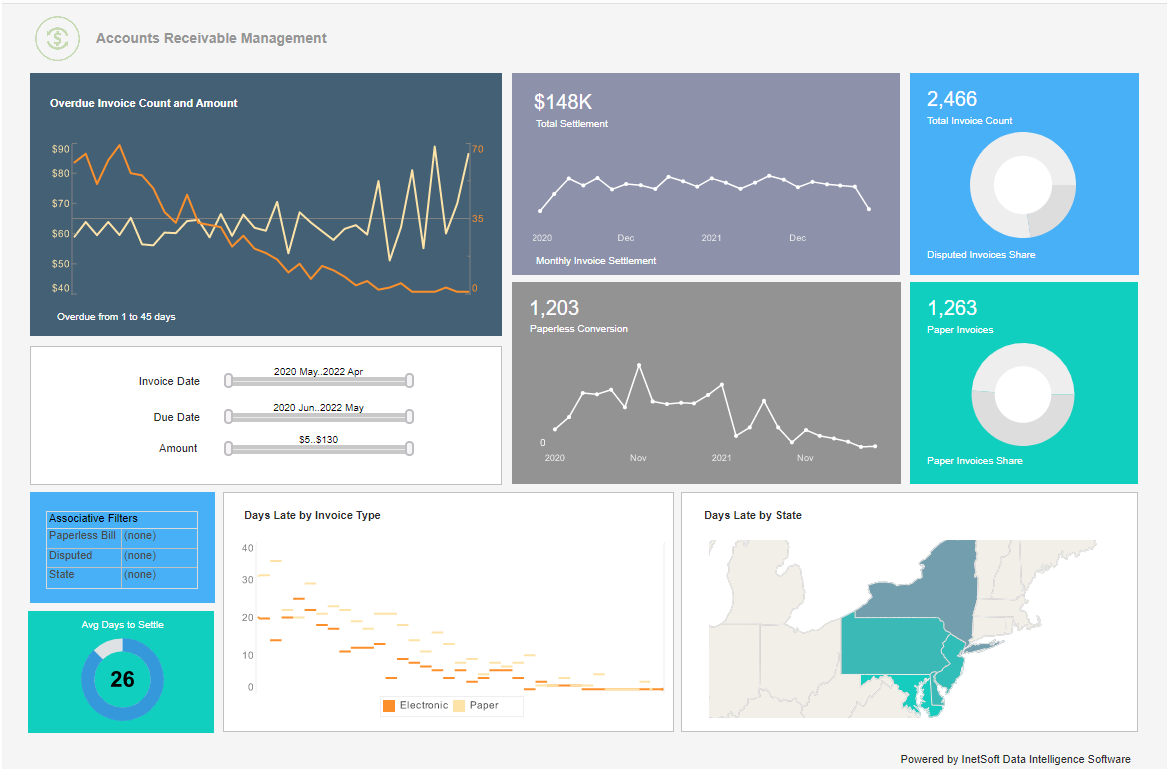
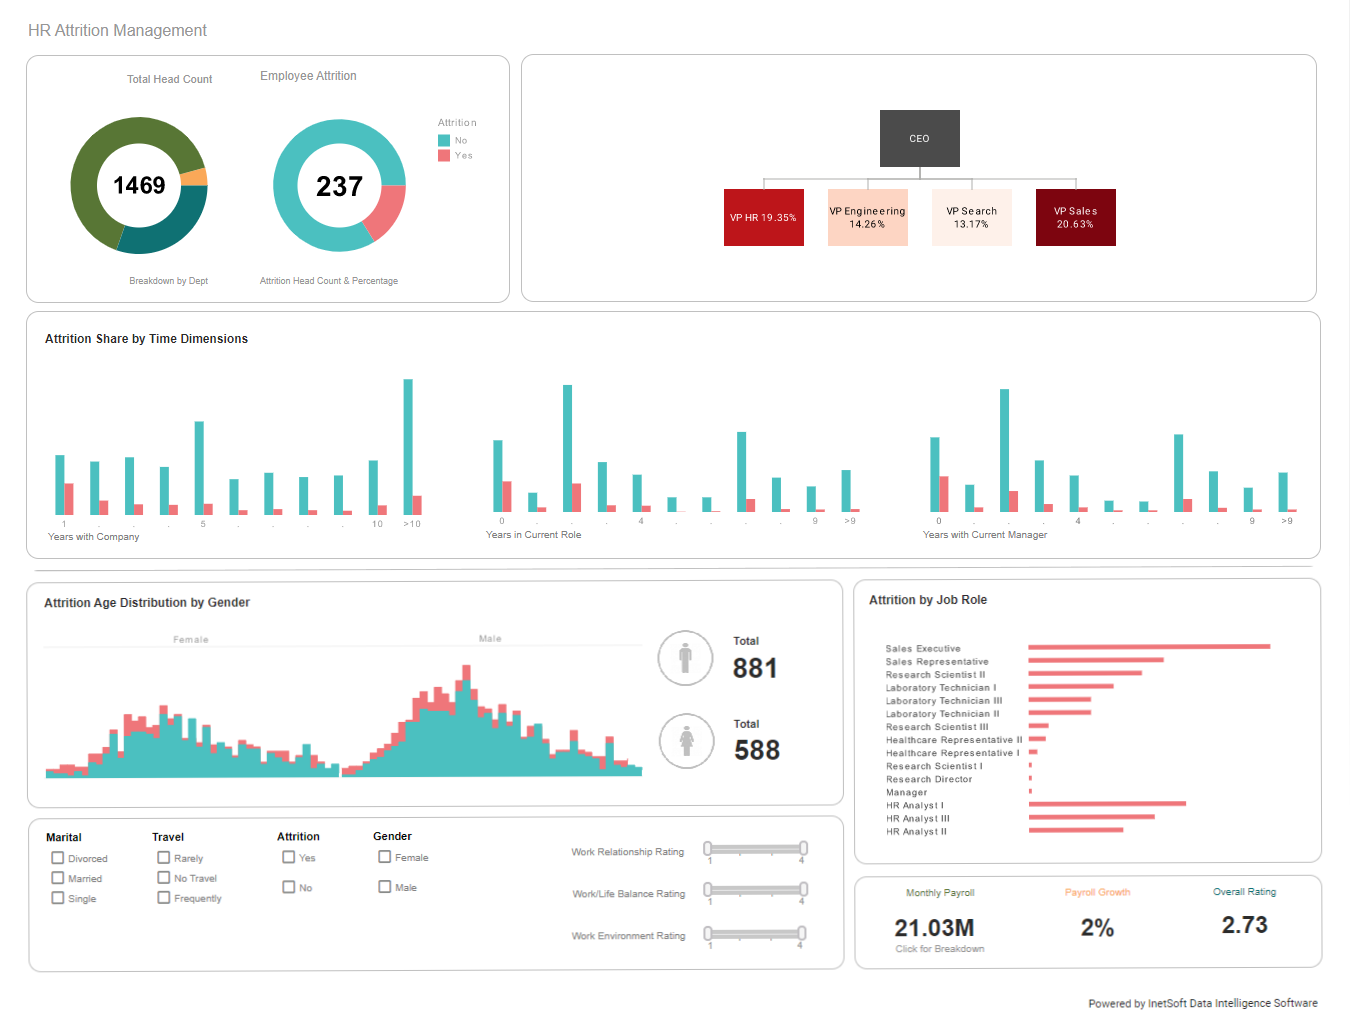
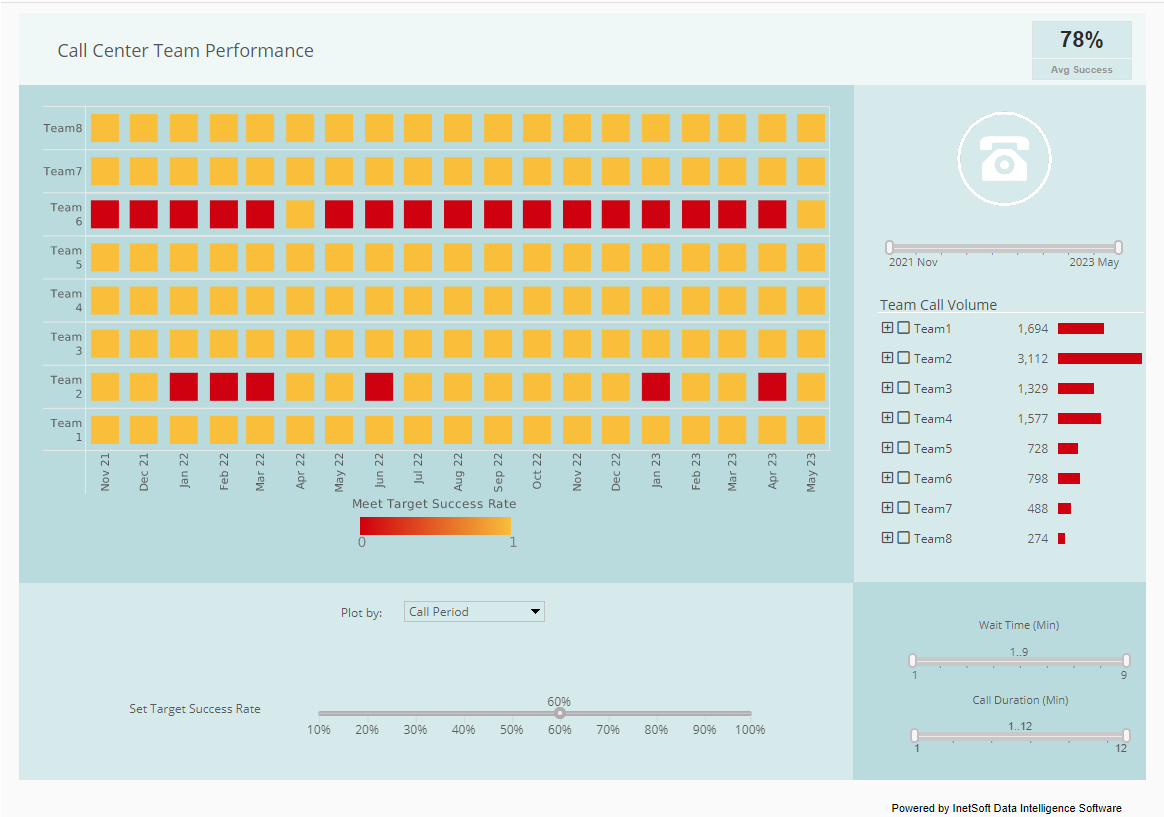
InetSoft has been able to make BI even more efficient with the addition of real-time dashboard reporting. Using InetSoft's intuitive interface, users are able to create pixel-perfect visualizations and dashboards that not only meet the current needs of any business, but can also adapt to changing needs at any time.
InetSoft utilizes techniques such as caching, materialized views, and pre-aggregation in order to access even the biggest sets of data in real time. This technology has combined high-performance data accessibility with the ability to easily generate visualizations and reports so business owners can analyze data in a new way without needing advanced IT experience.

Real Time Data Block Technology
InetSoft is set apart from other businesses with the use of Data Block technology. Rather than relying on pre-purposed BI needs, Data Block technology allows a user-friendly data mashup in a Lego-like block fashion that is made to represent data in a way that is understandable to business users. Users can drag and drop data into visual elements such as charts, sliders, tables, and more.
With InetSoft's point-and-click interface, users can transform this data in order to meet any business queries in real time. Users get the ability to work hands-on and transform data without having to rely on IT specialists.
Interact with Big Data
Using Data Grid Cache technology, InetSoft offers high-performance capabilities for large volumes of data and users. With the combination of in-memory database technology and disk-based access, users can access data in real time from a mashup of several sources, or it can be cached on disk by InetSoft's server as specified time intervals.
Pure in-memory storage means that businesses are limited by the size of memory in the BI server. However, with Data Grid Cache, InetSoft can scale up to meet any company's needs. InetSoft allows users to interact with their data and dashboard visualizations in real time to analyze any data and pin-point the source of any changes without any lag time or complicated updates required.

Fenwick Enclosures and Its Shift from Geckoboard to InetSoft
Fenwick Enclosures is a family-owned company that operates in a niche many people never think about: the design and manufacturing of industrial acoustic enclosures. These are specialized housings built to reduce noise generated by heavy machinery, generators, HVAC systems, and industrial compressors. The company, founded in the late 1980s, carved out a reputation for providing custom-built soundproofing solutions to manufacturing plants, hospitals, and data centers. Over time, the industry became more complex. Noise regulations tightened, customers demanded real-time performance monitoring, and large facilities wanted digital interfaces alongside their physical products. Fenwick responded by integrating IoT sensors into its enclosures, enabling clients to track vibration, noise levels, and airflow in real time. But as their offerings became more data-driven, the company’s reporting platform—Geckoboard—proved insufficient. By 2025, Fenwick made the strategic decision to switch to InetSoft for its real-time dashboard reporting.
Limitations of Geckoboard
Geckoboard initially seemed like the right fit for Fenwick Enclosures. It was easy to set up, offered attractive dashboards, and could display key metrics in a visually engaging way. The company used it for monitoring production progress, sales performance, and customer service tickets. However, as the business evolved, several limitations emerged. First, Geckoboard was primarily geared toward high-level dashboards. It was excellent for showing executives a snapshot of the day’s performance but lacked the depth required for more complex, multi-source analysis. Fenwick’s operations depended on blending data from IoT sensors inside enclosures, ERP data on production timelines, and maintenance records from field service teams. Geckoboard’s integrations could not keep pace with the volume or complexity of these sources.
Another issue was scalability. Geckoboard worked well when Fenwick only had a handful of dashboards, but as more departments adopted it, licensing and performance issues surfaced. The engineering team wanted real-time vibration and acoustic compliance dashboards, procurement wanted supply chain tracking, and marketing wanted customer engagement data. Attempting to accommodate all these needs resulted in fragmented reporting, with each department building its own isolated view. This created data silos and undermined cross-departmental decision-making. Leadership realized that while Geckoboard was user-friendly, it was not a long-term enterprise solution.
Why InetSoft Was Chosen
When evaluating alternatives, InetSoft stood out because of its strong reputation for handling real-time, complex data integrations. Fenwick needed more than pretty charts—they needed a platform capable of combining sensor readings, financial data, and operational inputs into a single analytical framework. InetSoft’s data mashup capabilities were particularly appealing, as they allowed the company to merge IoT sensor feeds with ERP data without relying on constant IT intervention.
Another factor was flexibility. Fenwick’s clients increasingly asked for access to dashboards showing the performance of their enclosures. With Geckoboard, customer-facing dashboards were limited and static. InetSoft, however, allowed Fenwick to build secure, role-based dashboards that clients could log into. A hospital could monitor noise levels around its backup generators, while a data center could keep tabs on cooling unit enclosures. This client-facing dimension transformed the reporting function from an internal tool into a value-added service, strengthening customer relationships.
Finally, cost efficiency played a role. InetSoft offered enterprise-level functionality at a price that scaled more predictably than Geckoboard’s per-user licensing model. For a mid-sized business like Fenwick, this meant they could expand usage without watching costs spiral out of control.
Implementation and Early Wins
The transition began with a pilot project in the operations department. Fenwick’s IoT-enabled enclosures streamed vibration and decibel readings into a cloud database. Using InetSoft, the IT team built dashboards that displayed real-time compliance against occupational safety standards. Within weeks, plant managers could identify which enclosures were underperforming, pinpoint issues in design, and dispatch technicians before customers even noticed problems. This proactive approach reduced service calls by 20% in the first quarter after implementation.
Encouraged by this success, the finance and procurement departments joined the rollout. They used InetSoft to track supplier delivery timelines against project schedules. With Geckoboard, procurement had only been able to see delayed orders once they were already impacting production. Now, they could forecast bottlenecks in advance by correlating supplier history with real-time project needs. This gave Fenwick leverage in supplier negotiations and improved delivery reliability to end customers.
Another major milestone came when the marketing department gained access to customer engagement dashboards. InetSoft allowed them to track client portal usage, maintenance logins, and performance queries from customers using the enclosures. This data revealed patterns in customer behavior, enabling the company to tailor after-sales service offerings. Marketing began using these insights to promote premium maintenance packages, directly increasing revenue.
Cultural Impact and Collaboration
One of the most profound effects of the switch was cultural. With Geckoboard, most dashboards were passive displays mounted on office walls. They were conversation starters but not decision-making tools. InetSoft changed that dynamic. Employees across departments could interact with data, drill down into specifics, and collaborate around live reports. Weekly meetings shifted from debating anecdotal evidence to working directly with dashboards. This built trust in the data and created a culture of accountability.
Moreover, the transparency improved relationships with clients. Previously, customer reporting involved PDF exports or emailed summaries. Now, Fenwick could offer clients a login to live dashboards, giving them transparency into their enclosure’s performance. This differentiated Fenwick in a competitive market, where many suppliers still relied on static reports. Clients appreciated the ability to verify compliance in real time, and this helped Fenwick win several large contracts with government facilities that valued traceability and accountability.
Strategic Benefits
Strategically, the move to InetSoft aligned with Fenwick’s long-term vision of being not just a manufacturer but a provider of intelligent acoustic solutions. By embedding data services into their product, they moved up the value chain. Instead of selling enclosures alone, they were now selling peace of mind backed by real-time analytics. InetSoft’s scalability meant they could continue expanding this model without worrying about hitting a ceiling. They also began experimenting with predictive analytics, using historical sensor data to forecast when an enclosure might fail or need servicing. This opened the door to offering maintenance-as-a-service contracts, a new revenue stream that could stabilize earnings in a cyclical industry.
Looking Forward
Fenwick Enclosures’ switch from Geckoboard to InetSoft demonstrates how a company in a highly specialized, obscure industry can reinvent itself by adopting the right BI platform. Geckoboard served as a stepping stone, but its limitations became apparent as the business grew. InetSoft provided the robustness, flexibility, and real-time capabilities necessary to not only manage internal operations but also deliver value directly to clients. The company is now planning to expand dashboard offerings globally, integrating multilingual support and regional compliance metrics to serve clients in Europe and Asia. As they continue to evolve, Fenwick shows how even a niche manufacturer can leverage enterprise-grade analytics to punch above its weight in the global market.


