Retail Store Dashboard Analytics
Facing the rapid development of the big data era, especially with the increased frequency of online shopping - numerous types of sales data can be collected. To succeed in todays modern retail industry requires modern solutions for modern problems and constant optimization. Today's data-driven industry heavily relies on data analytics to aggregate and track various KPIs. Retailers are turning to data visualization and interactive dashboards to stay competitive.
Making better and faster decisions with data is becoming a critical mission for the retail industry. By utilizing InetSoft's analytics tool, retail managers can identify sales patterns and adapt their strategies appropriately. This InetSoft retail dashboard is the solution to help the retail industry improve its performance and profitability.


How Do You Measure Retail Performance?
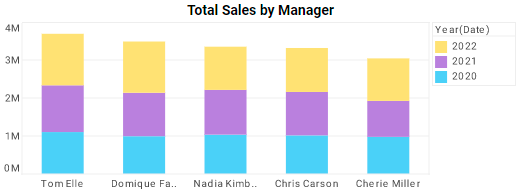
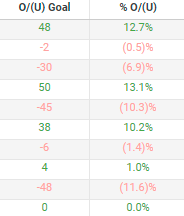
The main objective of retailers is to achieve continuous profitability and accelerated growth of revenue. Made with Style Scope by InetSoft, this retail dashboard clearly indicates the sales patterns that would help retail managers identify key factors that affect profitability and improve sales performance. InetSoft's dashboard analyzes retail performance with a table that contains expected goals, actual credit, and their difference and percentage of accomplishment based on monthly and annual periods.
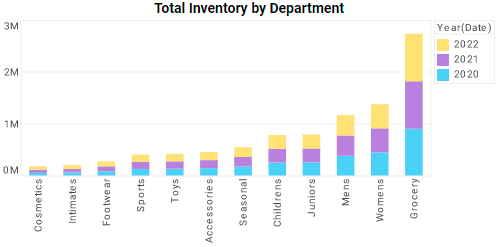
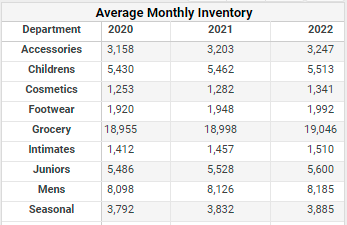
Focusing on the difference and percentage of accomplishment metric, this table gives retail managers an overview of retail performance in recent years. To further see the overall performance in recent years is to compare the total inventory in all the departments in recent years, so that retail managers can have a sense of which departments are most popular, based on the increased total inventory per year. The dashboard, made with InetSoft's Style Scope technology also features a bar chart to indicate the total inventory of all departments in a more direct way, and breaks down the bars by color to indicate year. InetSoft's retail dashboard can not only let retail managers know the retail performance and total inventory during certain periods, it also help retail managers compare them for the sake of improvement.

From observing the monthly performance and the popularity of the retail products, retail managers can launch specific campaigns, like offering discounts, promotions, sales or other marketing initiatives, to increase sales and revenue.
From the total inventory chart, retailers can tell the grocery, women and mens departments have the most total inventory, which reflects that those departments are most popular among all the departments.
Thus, while retailers make measurements or allocate resources, like advertising budget or promotions, they can consider these three departments to be a priority. Once we have a global overview of retail business, we can take a further step into detailed analysis.
What KPIs Should Be on a Retail Dashboard?
In order to find out what prominent metrics can help define future strategies and optimize profits, we must find out what kind of products are underperforming and why. InetSoft's retail dashboard digs deeper into the analytics data by breaking down inventory, units per transaction and shelf delays by months and departments. Here is how InetSoft's retail dashboard steps in: by utilizing Style Scope technology in InetSoft's dashboard, retail managers can measure metrics at different periods of time and visualize them together in one single chart to have a bigger picture of their organization's evolution.
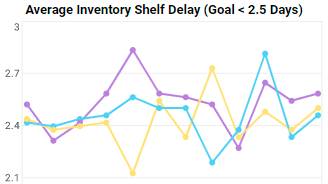

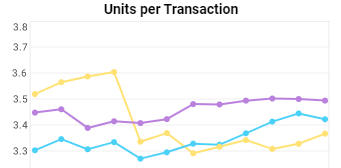
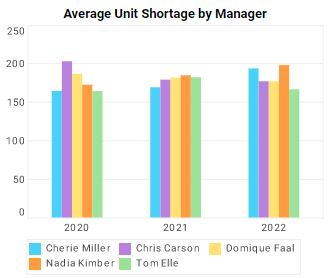
The first step is to evaluate average units per transaction by months in recent years. From there, retail managers can do a longitudinal comparison and analyze which months in a year normally have the most average transactions. By combining it with the inventory shelf delay days chart, which is designed to indicate which months always experience shelf delay in a year and their performance, retail managers are able to tell which months require more effort. For example, based on the average units per transaction chart, retail managers can see that the trading volume in the spring season keeps increasing.
Thus, in the spring season, the retail departments can prepare more stock in advance. Merchandise supply chain is always an important factor that directly affects sales. Thus, inventory is an important metric to track. It indeed tells retail managers a lot about inventory management, for example, how inventory shortage affects sales, how to reduce unnecessary restock to avoid loss etc.
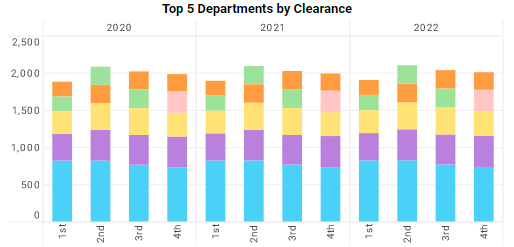

Monitoring inventory is one of the successful keys to maintaining retail business performance. Through InetSoft's retail dashboard, retailers can see the inventory in different departments over time and identify the potential bottlenecks quickly so they can make improvement measures in time. Whether they are facing high shortages or surplus inventory, retailers should be concerned about the efficiency of the inventory and supply chain management. By visualizing the top 5 best-seller departments and the total inventory in different departments in InetSoft's retail dashboard, retail managers can see if their popular departments have the most inventory correspondingly to avoid shortages. That way, retailers can anticipate their inventory and avoid back orders that leave customers unsatisfied. InetSoft's retail dashboard provides great insights that will help the retail industry adjust their resources and make improvements.
Retail Store Analytics with InetSoft
With InetSoft's dashboard, retailers have all the KPIs they need to track, gathered in one efficient overview. Utilizing Style Scope's features in InetSoft's retail dashboard, retailers are able to visualize and report all important retail KPIs in one central interface and turn this collected data into actionable insights, which makes it easy to add more metrics, adjust according to retailers' needs, and ensure their analytics are up-to-date. Style Scope offers extremely flexible tables and chart types that can embed sophisticated calculations so that users can easily engage in creating new dashboards and performing ad hoc chart editing for their business analysis.
Besides, InetSoft's StyleBI can help measure the performance of the retail supply chain and evaluate the perfect inventory in every season or holiday. With StyleBI by InetSoft, retail managers can set a target and actually reach it. With InetSoft's fully integrated machine learning and business intelligence engine, productionalization is greatly simplified for users. InetSoft's dashboards provide the business intelligence that the industry needs, which has a massive impact on increasing competitiveness among companies or organizations in the same field. More importantly, the InetSoft application is 100% web-based and delivers maximum self-service to both developers and end-users.
With the help of InetSoft products, the retail industry can identify where to better allocate resources, increase their productivity, and ensure their customers are satisfied in an operational and strategic way.